
Volume analysis in forex requires care because there is no single consolidated tape covering all spot currency trading. Retail platforms may display tick volume, while a futures exchange reports contracts traded on its own venue. Both can support analysis, but they measure different things. The first step is to identify the dataset rather than assuming a bar labeled "volume" represents the entire currency market.
The First Question Everyone Asks: Does Volume in Forex Even Matter?
Let's address the elephant in the room right away. Does volume even work in Forex? It's a fair question, and it trips up a lot of people. If you look at standard platforms, the data isn't a global tally of trades. You are usually looking at tick volume, meaning the number of times the price updated in that specific time frame, not the exact dollar amount traded across the whole world.
Unlike stocks or futures, Forex isn't traded on a single, centralized exchange where every transaction is tallied up in one neat ledger. It’s an over-the-counter market. Banks, hedge funds, liquidity providers, and retail brokers are all trading across a large, decentralized network. Because of this, the "volume" you see on standard retail platforms isn't true, centralized transaction volume.
What you’re usually seeing is tick volume.
Tick volume just measures how many times the price updated during a specific time frame. It won't tell you exactly how many contracts changed hands, but it does tell you how active the market was. And practically speaking, that’s useful. If the price is ticking up and down frantically, activity is high. If it's barely moving, the market is basically asleep.
Think of it like standing outside a football stadium. You can’t count the exact number of people in the seats, but when the crowd goes absolutely crazy, you know something big just happened. That noise means something, even without an exact headcount.
That’s the healthiest way to view Forex volume. It’s not perfect. It's not a complete picture. But if you use it consistently on the same data feed—and stop trying to compare raw numbers across five different brokers—it’s an amazing tool for confirming what price is doing.
The mistake isn't using imperfect data. The mistake is treating it like a magic signal rather than just one piece of the puzzle.
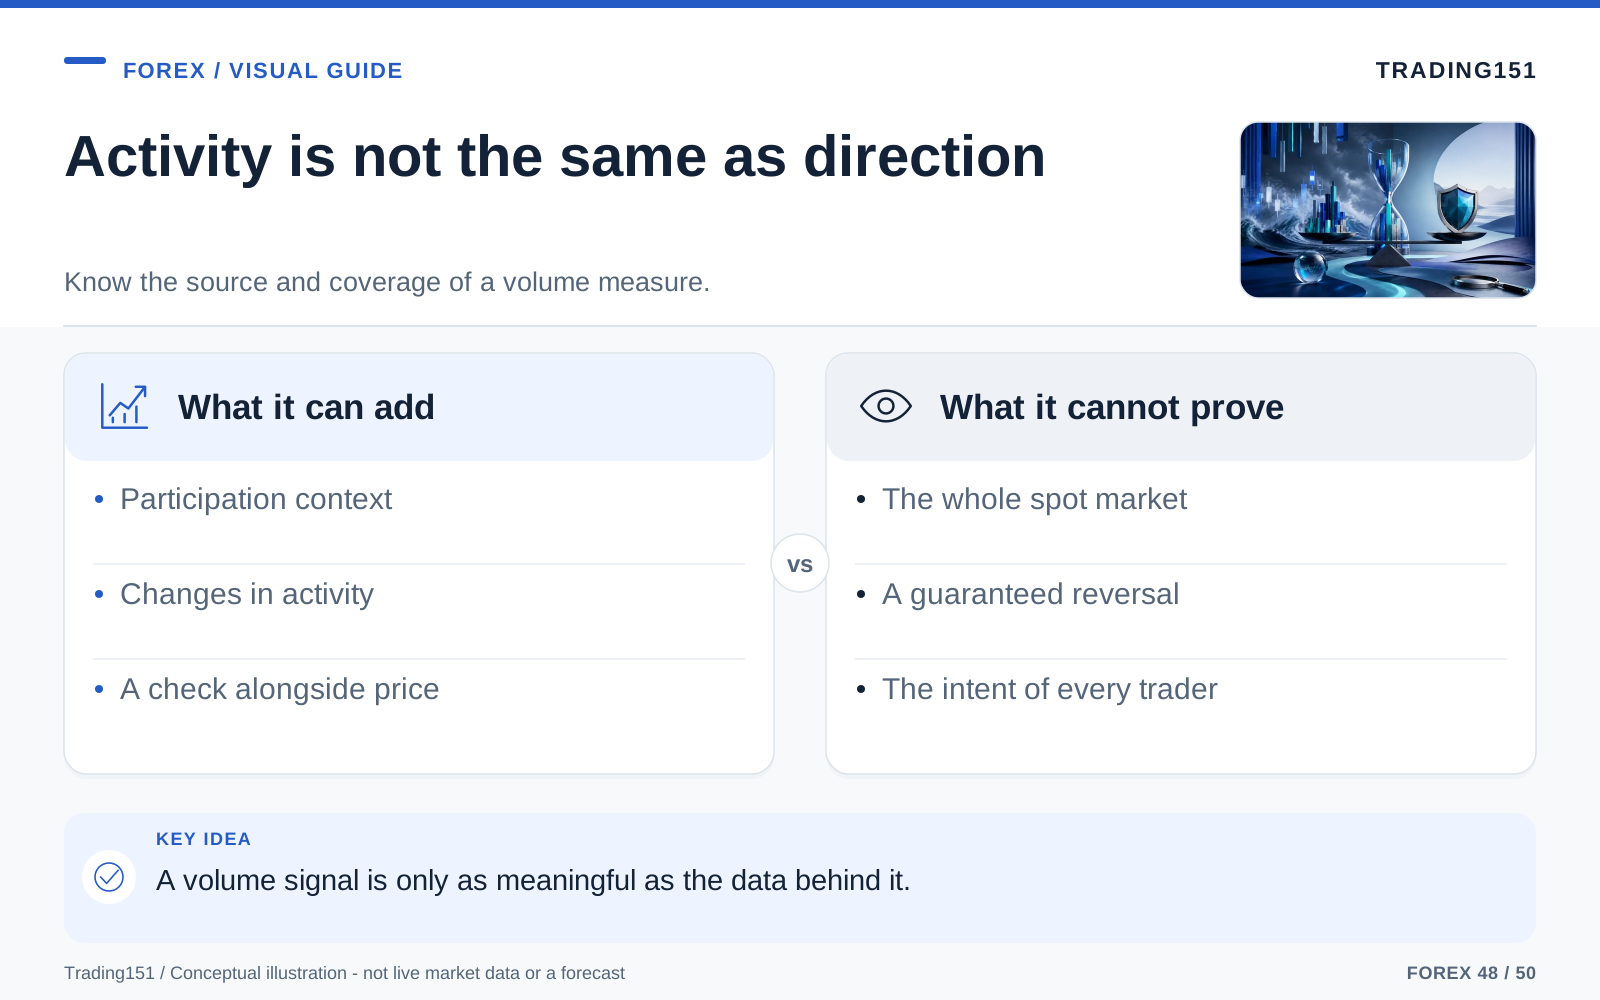
Read this diagram as text
- What it can add
- Participation context; Changes in activity; A check alongside price
- What it cannot prove
- The whole spot market; A guaranteed reversal; The intent of every trader
Why Volume Changes the Way You Read a Chart
Price alone can be a large liar. A big green candle doesn't tell you if the move was driven by a lot of aggressive buyers, or just a lack of sellers during a quiet lunch hour. It only shows you the end result.
Volume adds the missing context.
Think of a car trying to drive up a steep hill. The car's movement is the price; the engine's RPM is the volume. If the car is moving up and the engine is roaring, the progress makes sense. But if the car is still inching upward while the engine is puttering out, you know it's going to roll back down soon.
That’s all volume analysis really is. It gets you asking better questions:
- Is this trend healthy? Strong trends usually have steady, consistent participation backing them up.
- Is this breakout for real? A clean break of resistance on dead volume is a large red flag.
- Is momentum dying? Price can keep drifting in one direction for a surprisingly long time after the real conviction is gone.
- Did a major battle just happen here? A sudden, large volume spike near a key level usually means big players are fighting over the price.
By itself, a volume bar is just a line at the bottom of your screen. But in context, it becomes a filter. And surviving in this game is all about having good filters. The more low-probability trades you can avoid, the better your equity curve will look.
The Core Relationships Between Price and Volume
You don't need a math degree or messy formulas to read volume. The magic is in understanding a few basic price-volume relationships and seeing how they play out on the chart.
1. Rising Price and Rising Volume
This is the textbook definition of a healthy trend. Buyers are pushing the price up, and more people are jumping in as the move develops. It doesn’t mean the trend will last forever, but it shows that the broader market is actively supporting the move rather than just floating upward on low interest.
When you see this, buying pullbacks usually makes a lot of sense. The market is moving, and the crowd agrees with the direction.
2. Falling Price and Rising Volume
This is the same concept, just in reverse. Selling pressure isn’t just present; it’s building. When price dumps and volume swells, there’s genuine urgency behind the move. This could be panic selling, stop-loss hunting, or just a heavy institutional repricing.
When you spot this, respect the downside. Don't assume every dip is an immediate buying opportunity.
3. Rising Price and Falling Volume
This is where things get tricky—and interesting. Price is making higher highs, but fewer and fewer traders are participating. It doesn’t mean you should immediately short the market; trends can drag on way longer than makes logical sense. But it is a glaring warning sign.
When a move keeps going but the backing is hollow, it's vulnerable. Maybe the buyers are exhausted. Maybe the market is creeping into a resistance zone where nobody wants to buy. Either way, it’s a great time to trail your stops, protect your profits, and stop chasing new long entries.
4. Falling Price and Falling Volume
This usually signals a lack of selling pressure rather than an aggressive continuation of a downtrend. Sure, sellers might still be in control, but the urgency is fading. If this happens during a pullback in a broader uptrend, it’s a great sign—it means the market is just taking a breather. In a major downtrend, it hints that the market might need a fresh catalyst before it can drop any further.
By itself, it isn't a reason to buy. It just tells you the downside momentum is cooling off.
5. Volume Spikes at Important Areas
Pay close attention to these. When volume suddenly explodes near a major support or resistance zone, a previous daily high, or during a news event, the market is screaming that this price matters.
Sometimes the spike means continuation. Sometimes it's pure exhaustion. Sometimes it's a vicious tug-of-war between buyers and sellers, and you just have to wait for the next candle to see who won. But one thing is certain: large volume at key structure is rarely an accident.
Context Matters More Than the Indicator
If there's one place traders mess up with volume, it's ignoring the context. Volume is entirely relative to the time of day, the pair you're trading, and what just happened on the chart. A volume bar that looks absolutely large during the quiet Asian session might be completely average once London opens. You have to compare apples to apples.
A giant volume bar means absolutely nothing in a vacuum. You have to ask yourself: where did this happen? What was price doing right before this? Are we at a major level, or just floating in the middle of a range?
The same volume spike can mean two completely different things depending on where it prints.
A surge in volume during a tight range breakout usually points to a genuine push. A surge after a large, multi-day uptrend, leaving behind a huge wick? That's likely a blow-off top. And a volume spike the exact second a major news report drops might show real participation, but it usually just creates chaotic, untradable chop.
This is why pros don’t use volume like a traffic light. It's not just "green means go, red means stop." It’s more like reading body language. It tells you the mood of the market, but you still have to pay attention to the actual conversation.
The Most Useful Volume-Based Tools for Forex Traders
Plain volume bars are usually all you need. But if you want to make reading the data a little easier, a few classic tools pull their weight.
1. On-Balance Volume (OBV)
OBV is an old-school tool, but it works surprisingly well. It just keeps a running tally, adding volume on up days and subtracting it on down days. Don't worry about the actual number on the indicator—just look at the direction the line is moving.
If price is making higher highs but the OBV line is flat or dropping, you’ve got a divergence. It tells you the upward momentum is hollow. Again, don't blindly fade the move, but take it as a solid heads-up that the trend is walking on thin ice.
2. Volume Weighted Average Price (VWAP)
Day traders absolutely love VWAP. It blends price and volume to show you the true average price of the market over a specific period, acting like a dynamic line of fair value. But here's the catch: in decentralized spot Forex, your VWAP is only as good as your platform's volume feed. Plus, VWAP depends heavily on where you anchor it—whether it's the start of the session, a major news event, or a weekly low. Always know what your VWAP is anchored to, otherwise you and another trader could be looking at two totally different lines.
If the price gets stretched way far away from VWAP, it tends to snap back. When it does pull back to the line, traders watch closely to see if it holds as support or resistance. It’s a fantastic tool, provided you pair it with actual price action and timing.
3. Money Flow Index (MFI)
Think of the MFI as the RSI's cousin, just with volume factored into the math. It’s great for spotting overextended markets, especially when things are ranging or moving slowly.
Like any oscillator, high readings mean overbought and low readings mean oversold. Just remember that strong markets can stay overbought for a painfully long time. MFI works best when you line it up with a strong rejection candle at a known level of support or resistance.
4. Plain Volume Bars
—You don't need a cockpit of indicators to trade well. For a lot of traders, standard vertical volume bars at the bottom of the chart are the best option because they keep things simple. Is volume expanding, shrinking, or exploding right at a major level? Answering that one simple question will put you miles ahead.
How to Use Volume in Real Trading Situations
Theory is great, but it’s useless if it doesn't help you execute better trades. (Side note: some traders use currency futures volume as a proxy for spot Forex since futures volume is centralized. It's a clever way to get better context, but remember they aren't a perfect one-to-one match. You have to account for rollover dates and trading hours, so test it before pasting futures data straight into your spot strategy.) Here’s how you can use volume day-to-day.
1. Confirming a Breakout
Breakouts are notorious for trapping traders. A setup can look strong right before it violently reverses. Volume is your best defense here.
Imagine price has been banging its head against resistance for an hour. Finally, a candle pushes through. Before you click buy, look down. How does the volume on the breakout candle compare to the last bunch of bars?
If volume clearly spiked, the market is actively participating in the break. It’s not just a few stray retail orders; real money is stepping in. That doesn't guarantee a winner, but it massively improves your odds over a low-volume breakout.
If it breaks out on pathetic, whisper-thin volume and instantly stalls, sit on your hands. Fakeouts thrive on low volume because there's no buying pressure to sustain the move once the initial stop-losses are triggered.
2. Spotting Exhaustion After a Strong Move
When a trend has been running hot for a while, keep an eye out for a sudden volume spike paired with a long wick or a candle that fails to hold its highs. This is classic exhaustion.
It doesn't mean you should immediately call the top and short it. It means a transfer of power is happening. The late-to-the-party retail traders are panic-buying right as the institutional players are happily dumping their positions to take profit. When this happens at a major level, the risk of a reversal goes sharply higher.
3. Evaluating Pullbacks Inside a Trend
This is an underrated way to use volume. A healthy, normal pullback should happen on lower volume than the impulsive move that preceded it. In an uptrend, you want to see big volume on the pushes higher, and quiet, shrinking volume on the dips. That tells you the dip is just a corrective breather, not a large wave of sellers taking over.
It helps you hold your nerve and tell the difference between a harmless pause and a nasty reversal.
4. Reading Reactions at Key Levels
Support and resistance zones aren't magic walls; they only work if traders react to them. When price taps a major level and volume suddenly surges, the market is voting. Maybe the level holds firm, or maybe it breaks aggressively. Either way, that volume spike tells you people care about that specific price.
Treating every line on your chart the same is a quick way to lose money. Volume helps you see which levels are in play.
Two Practical Setups Worth Testing
There's no ideal setup in trading, but if you want to start using volume, here are two highly practical frameworks to test out.
Setup 1: The High-Participation Breakout
What you’re looking for: Price cracks a clear support or resistance level, driven by a breakout candle with volume that noticeably dwarfs the recent average.
- Find a clean level the market has tested multiple times.
- Wait for a hard, decisive close past that line.
- Look at the volume—is it significantly higher than the previous cluster of candles?
- If yes, look to enter on the continuation or a tight retest of the broken level.
Why it works: Real breakouts need horsepower. A surge in volume shows that a broad group of participants is actively backing the move.
What invalidates it: If the breakout happens on weak volume, immediately wicks back into the range, or stretches way too far into the next resistance zone, let it go.
Setup 2: The Exhaustion Reversal
What you’re looking for: An overextended move that ends in a large volume climax and an ugly rejection candle, like a long pin bar.
- Find a market that has been trending hard in one direction.
- Wait for a climactic candle with unusually large volume.
- Look for blatant rejection—a large tail, a failed push past a major level, or a total lack of follow-through.
- Wait for the very next candle or structure shift to confirm that momentum has changed before jumping in.
Why it works: Trends often die in a frenzy. The last wave of desperate traders gets sucked in at the exact wrong moment. When the market can't hold those highs despite crazy high volume, the trend is likely exhausted.
What invalidates it: Don't assume every big volume bar is a reversal. Sometimes a large bar is just strong continuation. You absolutely must wait for price action to confirm the rejection.
Common Mistakes Traders Make With Volume
Volume is a fantastic tool, but it’s easy to misuse. Here’s how most traders trip themselves up:
- Trading off a single bar: One big volume bar doesn't mean anything in isolation. Always compare it to what happened right before it and where it printed on the chart.
- Ignoring time of day: Forex volume naturally ebbs and flows. A spike at the London open is normal; a spike in the dead of the Asian session means something unusual is happening. Don't treat them equally.
- Trading the news blindly: Big economic releases will always print large volume bars and wild, chaotic wicks. High volume during a news blast isn't a clean, tradable signal—it's usually just noise.
- Ignoring market structure: Volume is completely useless if you aren't paying attention to trends, ranges, and key support/resistance zones.
- Looking for a crystal ball: Volume tips the odds in your favor. It doesn't mean you'll never hit a stop-loss again.
A Simple Routine for Using Volume Every Day
If you want to integrate volume into your daily trading without cluttering your mind (and your screen), keep it this simple:
- Map out your structure first. Draw your ranges, mark the trend direction, and find your key support/resistance levels.
- Watch the rhythm. Is volume rising on the pushes and shrinking on the pullbacks?
- Sit up and pay attention when price hits one of your drawn levels and volume suddenly spikes.
- Before you trade a breakout, do a gut check: is the volume there to support it?
- Before you try to catch a falling knife or short a rally, ask yourself: does this volume spike look like true exhaustion, or just a really strong trend?
This simple routine keeps volume in its proper lane. It’s supposed to sharpen your intuition, not replace your brain.
Name the volume source every time it matters
Tick volume commonly counts price updates or ticks supplied by a feed during a period. It is not a direct count of all currency units exchanged globally. Its relationship with activity can be useful in some settings, but it depends on the feed, instrument, and period. A change in provider or data handling can alter the series without an equivalent change in global trading.
Futures volume is actual exchange trading volume for the relevant contracts, but it describes that futures market. Contract expiry and rolling can shift activity between maturities. A continuous chart may join those contracts under a rule that affects the appearance of volume and price. Understand the construction before comparing it with spot prices.
Avoid inferring a participant's intention from volume alone. Heavy trading can accompany both buying and selling pressure because every completed transaction has counterparties. The combination of price behavior and trade classification may provide additional information, but the interpretation still depends on the data and method.
For a strategy, state exactly what a volume condition adds. Does it filter a breakout, identify a session, or alter position size? Test it against the same rule without the filter, including periods when the relationship weakens. Volume is most useful as a clearly defined input, not as a universal confirmation that a favored chart pattern must be genuine.
Tick activity and traded quantity are different measures
A tick-volume indicator counts changes or updates under the provider's convention; it is not necessarily the number of currency units traded across the market. Exchange-traded futures volume measures transactions in a specified contract and venue. Both can be useful within their scope, but they should not be substituted for one another without explanation.
When testing a volume rule, keep the feed consistent and record any changes in provider or calculation. A sudden difference in the indicator may reflect the data source rather than a change in global trading interest. The definition belongs beside the signal. 1, 2
A Few Closing Thoughts
Let's be direct: Forex is tough because the charts always look so perfectly clean in hindsight, but feel totally chaotic in real time. In the heat of the moment, every little dip looks like a large reversal, and every tiny push looks like the start of a monster trend. That's why we’re always looking for something to help us gauge true conviction.
Volume gives you that perspective. It won't give you 100% certainty, but when you pair it with solid price structure, it’s one of the most reliable ways to see if a move is backed by real participation.
It will save you from buying into weak breakouts. It will give you the confidence to hold through a low-volume pullback. And sometimes, it will warn you that a market is about to reverse before the rest of the crowd even sees it coming.
So, the next time a large green candle blasts through resistance, and your finger is hovering over the buy button—just pause. Look at the context. Look at the level. And look at the volume. That half-second glance is often the difference between getting chopped to pieces and trading in sync with the market. Volume analysis is at its absolute best when it answers a specific question: Did the breakout have backing? Did the pullback dry up? Did a major level see large action without breaking? Don't fall into the trap of making up a wild institutional conspiracy theory for every tall volume bar. Keep it simple, combine it with price action, and see if it improves your trading.
Sources and further reading
- BIS: April 2025 FX turnover, September 2025 preliminary release
- CFTC: Eight things to know before trading forex
Editorial revision: 7 October 2026. Numerical scenarios are hypothetical unless identified as historical. References support the added explanations and selected corrections; rules and product terms should be checked again before acting.