
Fibonacci levels divide a selected price move into proportions that some traders use as reference points. Their usefulness depends heavily on which move is selected and how a trade is defined around the level. They do not establish an intrinsic value for a currency or prove that price must reverse. Treat them as a testable charting convention, not a law of markets.
What Fibonacci Means in Trading
The name goes back to Leonardo of Pisa—better known as Fibonacci—the mathematician who brought a famous number sequence to the Western world. You probably know it: each number is the sum of the two before it (0, 1, 1, 2, 3, 5, 8, 13, and so on).
But as traders, we don't really care about the sequence itself. What matters are the ratios between those numbers. As the sequence goes on, the relationship between the numbers settles into specific proportions—most notably 61.8%, which is famously known as the Golden Ratio.
When you plot these ratios on a trading chart, you get Fibonacci levels. The market isn’t secretly doing medieval math behind the scenes. These levels exist because markets move in waves. Traders are constantly hunting for that sweet spot where a pullback runs out of steam and the main trend kicks back in.
That’s the whole point. After a large move, price almost never just goes in a straight line. It pauses. It dips. It shakes out the weak hands. Fibonacci just gives you a way to measure how deep that dip is compared to the initial move.
This is useful in Forex. Currency pairs are notorious for trending heavily, retracing, and then taking off again. A pair might rally for two straight days, take a nasty dive during the London or New York session, and then shoot right back up. Without a game plan, that pullback just looks like chaos. Throw a Fibonacci tool on it, and suddenly it looks organized.
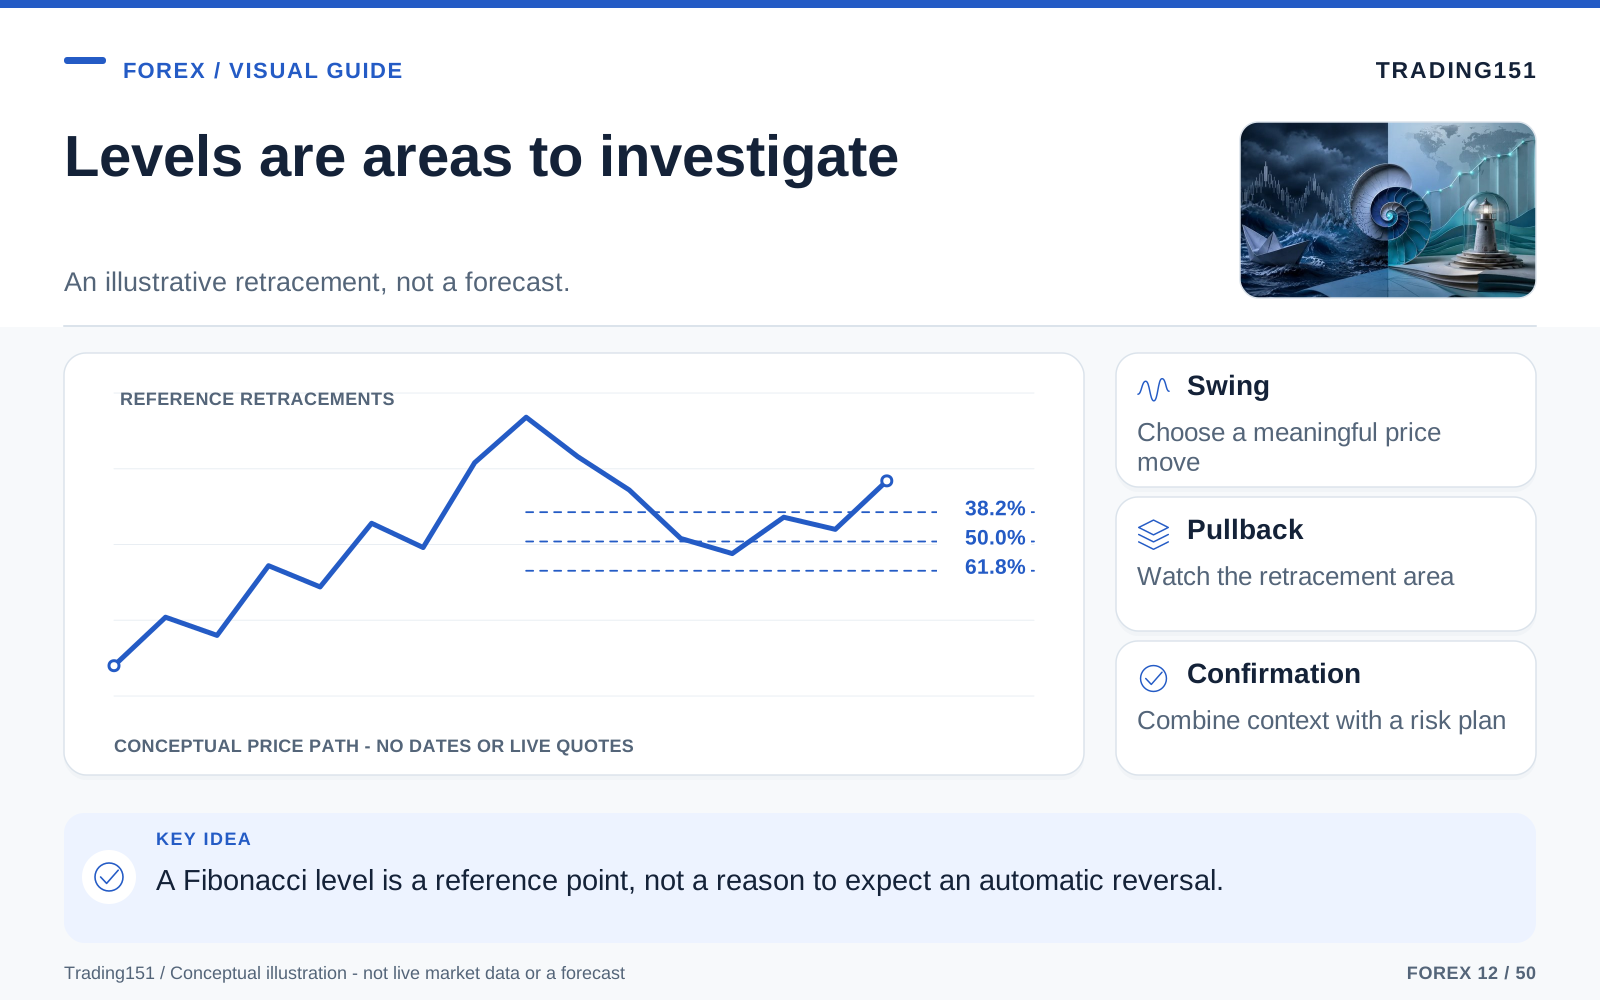
Read this diagram as text
- Swing
- Choose a meaningful price move
- Pullback
- Watch the retracement area
- Confirmation
- Combine context with a risk plan
The Key Levels Traders Watch
Most charting software plots the standard retracement levels for you automatically. Here are the ones traders pay attention to:
- 23.6%: A really shallow pullback. You usually only see this in aggressive, runaway trends where buyers (or sellers) are refusing to give up an inch.
- 38.2%: A standard, healthy retracement. Very common in clean, fast-moving trends.
- 50.0%: Okay, this one isn’t technically a Fibonacci ratio, but it’s a big deal. Markets love to react at the halfway mark of a move. We’re all human, and humans naturally think in halves.
- 61.8%: The big one. The level traders obsess over. If a pullback drops into this zone and holds, it’s a very strong signal that the overall trend is still alive and well.
- 78.6%: A deep, painful retracement. The trend can absolutely still recover from here, but you need to be careful—it’s walking a tightrope.
Beyond pullbacks, you've also got Fibonacci extensions. Traders use these as profit targets once the price breaks past the original high or low. The fan favorites here are 127.2% and 161.8%.
Think of it like this: if retracements tell you, "Where should I get in?" extensions tell you, "If this thing keeps running, where do I take my money?"
Why Fibonacci Works at All
This is where a lot of trading articles get totally weird. People will tell you that the market follows Fibonacci because the Golden Ratio is found in seashells, flower petals, galaxies, and human faces. It’s a fun piece of trivia, but you don't need to buy into any of that to make money. Fibonacci levels aren't laws of physics. They work largely because everyone is looking at them. Markets react around these zones because traders tend to group their buy and sell orders around familiar, predictable areas. You can bounce off a level, slice right through it, or reverse for reasons that have absolutely nothing to do with math.
Fibonacci works in trading for a very practical reason: a large amount of traders watch it, and those levels naturally line up with the way real markets behave during pullbacks.
Think about the psychology of a strong market move. Early buyers take their profits. Late buyers panic and sell. Contrarians try to bet against the trend. And all the folks who missed the initial breakout are sitting on their hands, waiting for a cheaper price to jump in. All of that chaotic buying and selling creates a pullback.
Fibonacci gives all those waiting traders a shared map. The market doesn't reverse just because a magical line is on your screen. It bounces because real traders see value there and start hitting the buy button.
So the real power of Fibonacci isn't mystical at all. It's behavioral. It's just putting a structure on crowd psychology.
How to Draw Fibonacci the Right Way
A solid Fibonacci setup requires a clean chart and a blindingly obvious trend. Most bad Fib trades happen because someone is trying to force the tool onto choppy, random price swings just to find a reason to trade. Drawing it requires a bit of an eye. If two people pick different starting points, they'll get different levels. To avoid this, you have to establish rules for yourself: figure out which timeframe you're trading, decide if you're drawing from the wicks or the candle bodies, and only measure moves that are finished. And please, draw your levels before the pullback happens. If you keep redrawing the lines until they magically fit what the price just did, you aren't doing analysis—you're just drawing pretty pictures.
Here is how to draw it properly:
- Find a real, undeniable directional move. You want a big, clean swing—not some tiny chop inside a messy range.
- In an uptrend, drag from the very bottom of the swing to the top. This shows you how much of the rally the market is giving back.
- In a downtrend, drag from the very top of the swing down to the bottom. This measures the bounce inside the sell-off.
- Use major turning points, not every random candle. The clearer the move, the more reliable the retracement levels will be.
If the market is just dragging sideways, put the Fibonacci tool away. It’s designed for trends. It’s totally useless when price is stuck in a range, changing its mind every three hours.
My rule of thumb is simple: if you have to squint and argue with yourself about where a move started or ended, the setup is garbage. Move on.
Strategy 1: Buying or Selling the Pullback Instead of Chasing
This is the bread and butter of Fibonacci trading, and it’s the one most of us stick to. The goal couldn't be simpler: wait for a trending market to pull back into a key zone, then look for a signal that it’s ready to keep going.
Let’s say EUR/USD shoots up because the U.S. dollar takes a hit. The pair climbs all morning, and by the time you sit down at your desk, the move is already huge. The urge to just hit "buy" before it runs away without you is intense.
And that is exactly where retail traders get slaughtered.
Instead of chasing, you pull out your Fibonacci tool, draw it from the bottom of the move to the top, and let the market come to you. If the price drifts back down into the 38.2% to 61.8% area, that’s your window. A lot of traders zero in on the space between 50% and 61.8%—what people like to call the golden pocket.
Why is this area so special? Because it’s usually deep enough to shake out the impatient buyers and offer a great price to the people who missed out earlier, but not so deep that it ruins the uptrend.
But just blindly buying at the line is a bad idea. The smarter move is to wait for the market to prove it's going to hold. You want to see something like:
- A large bullish engulfing candle
- A long wick showing buyers stepping in to defend the price
- A break back above a minor resistance level
- A noticeable shift in momentum as the selling dries up
If you're looking at a downtrend, just flip the logic. Measure the crash, wait for the relief rally into a key Fibonacci zone, and look for a bearish signal before you short it.
The goal here isn't to snipe the exact bottom or top to the pip. It’s about killing the habit of entering out of FOMO and starting to enter where the math and structure are on your side.
Strategy 2: Using Confluence to Filter Out Weak Setups
A single Fibonacci level is just a hint. But when you have three or four different technical reasons pointing to the same price area? Now you've got my attention. The trick with confluence is finding independent reasons to take the trade. If you have a Fibonacci level, a moving average, and a momentum indicator that are all just echoing the same exact data, that’s not real confluence. Real strength comes from combining a Fib level with higher-timeframe structure, the time of day, or major support and resistance.
This is what we call confluence, and it’s where Fibonacci gets really powerful.
Let's say GBP/USD drops right into a 61.8% retracement. Cool, but not enough to risk money on. Now, imagine that same 61.8% level is sitting directly on:
- An old resistance zone that should act as new support
- The 200 EMA on the 4-hour chart
- A rising trendline that the market has respected all week
- A beautiful bullish rejection candle
Now you aren't just crossing your fingers and trading a line. You’re trading a heavy cluster of evidence.
Markets don’t spin around just because a percentage pops up on your screen. They reverse because a lot of different traders see multiple reasons to buy at that exact spot. Confluence is how you find those areas.
Horizontal support and resistance usually matter way more than the Fib ratio itself. But when a major ratio and a major support level perfectly align? That’s an A+ setup. Waiting for these moments is what separates the pros from the gamblers. Amateurs see 61.8% and immediately click buy. Patient traders wait to see if the market cares about that level first. That little bit of hesitation will save you from a lot of losing trades.
Strategy 3: Planning Profit Targets with Fibonacci Extensions
Everyone obsesses over entries, but exits are usually where traders butcher perfectly good setups.
Picture this: you buy USD/JPY off a beautiful Fibonacci bounce. It works. You’re up 40 pips. Immediately, the psychological warfare starts. Should I take profit now? Should I hold out for more? What if it crashes and I lose it all? What if this goes for 200 pips and I look like an idiot for closing it early?
Fibonacci extensions are brilliant for stripping away that emotional guesswork.
When price breaks past the old swing high in an uptrend, you can use the 127.2% and 161.8% extension levels as logical places to take profit. They aren't guarantees, but they give you a concrete target on the map.
The best way to trade them is by scaling out:
- Take some off the table at the previous swing high or the first extension level
- Move your stop loss to break-even to protect your capital
- Let a small runner stay open to try and hit that juicy 161.8% extension
This approach keeps you sane. You lock in profits—which feels great—but you also leave the door open for a large home run if the trend really catches fire.
In Forex, where momentum can push pairs way further than you expect, having extension targets stops you from panic-closing a great trade just because seeing floating profit makes you nervous.
Where to Place the Stop Loss Without Getting Picked Off
A Fibonacci setup is completely useless if you manage your risk poorly. Without proper stop placement, Fibs are just a really sophisticated way to lose money. A lot of traders make the mistake of setting their stop based on their wallet rather than the chart. If the proper stop makes the trade too expensive, shrink your position size or walk away. Don't tighten your stop just to make your risk/reward ratio look pretty; you’re just begging the market to hunt you down.
The most classic mistake is tucking a stop-loss too tight. You buy at the 61.8% line, drop a stop five pips below it, and watch as the market dips to 65%, stops you out, and then rockets 100 pips in your direction. It is infuriating, and it happens every day.
The solution? Put your stop loss at the exact price where your trade idea is proven wrong.
If you buy the 50% level, putting your stop below the 61.8% mark or under a recent structural low makes sense. If you buy the 61.8%, your stop probably belongs below the 78.6% level or under the absolute bottom of the whole swing. (If you’re shorting, just do the reverse).
Stop asking yourself, "How tight can I make this stop?" Instead, ask, "At what price point am I flat-out wrong about this trend?"
That mindset shift changes everything. You stop placing hopeful stops and start placing structural ones.
Which Timeframes Work Best?
Technically, you can draw a Fibonacci grid on a 1-minute chart. Practically, that’s a terrible idea. The tool works best when you're measuring price swings that matter.
This is why higher timeframes are substantially more reliable.
On a 5-minute chart, the market is full of algorithmic noise, sudden spread spikes, and random chop. Fib levels down there just don't carry much weight. But on a 1-hour, 4-hour, or daily chart, a swing high or low represents serious money and major decisions by big institutions. Those levels command respect.
If you're relatively new to Forex, the 1-hour and 4-hour charts are the ultimate sweet spot. They give you enough setups to keep things interesting, but they move slowly enough for you to think. You have time to look for confluence and wait for candle closes instead of hyperventilating over every tick.
That doesn't mean lower timeframes are useless. A great technique is to find a major Fibonacci zone on the 4-hour chart, and then zoom into a 5-minute or 15-minute chart to hunt for a precise entry when price hits that zone. The big chart gives you the roadmap; the small chart gives you the sniper entry.
A Simple Real-World Example
Let’s put it all together. Imagine AUD/USD explodes upward after a killer jobs report out of Australia. The breakout is large, clean, and aggressive. Eventually, the buyers get tired near a recent daily high, and the price starts to slip backward.
You pull up your 4-hour chart and drag your Fibonacci tool from the bottom of that rally to the top.
Here’s what you see:
- The 50% to 61.8% zone lines up perfectly with an old resistance ceiling that the price just broke through.
- As the price drops into this pocket, the candles get smaller (momentum is dying).
- A beautiful bullish pin bar forms right on the level.
- The overall daily trend is still aggressively up.
This is a million miles away from blindly buying just because a line got touched. You have a story that makes sense. Buyers were in control, the market took a breather back into an old ceiling-turned-floor, and the price action is screaming that the sellers are out of gas.
So, you take the trade. You put your stop safely below the entire structural zone, and you use the recent high—plus the 127.2% extension—as your take-profit targets.
Will this win 100% of the time? Obviously not. But it’s a trade based on logic, context, and structure. If you take setups like this over and over again, you’re going to do just fine.
The Most Common Fibonacci Mistakes
People don't mess up Fibonacci because the math is hard. They mess it up because they use it at the wrong times, or they try to force the market to do what they want.
Here’s how traders usually screw this up:
- Trading in a sideways market. Fibs are for trends. If the market is moving horizontally, the levels are meaningless.
- Picking awful swing points. If you draw your lines over tiny, insignificant squiggles, your levels will be useless.
- Jumping the gun. Touching a Fib line is not a signal to trade. Wait to see if the market respects the line.
- Fighting the big trend. Buying a 5-minute retracement when the daily chart is in a free-fall is a great way to blow your account.
- Bending the chart to fit your bias. This is the deadliest one. Traders will constantly redraw their Fib lines until they magically line up with a trade they've already decided to take.
That last one is super dangerous because it feels like you're doing deep analysis. In reality, you’re just negotiating with the chart until it tells you what you want to hear.
The fix is easy: zoom out, find a swing that a five-year-old could identify, and be direct about whether the market is trending. If it’s muddy, skip the trade.
How to Make Fibonacci Part of a Real Trading Plan
Fibonacci is not a trading strategy on its own. It’s a tool. It works best when you plug it into a larger system.
A solid, no-nonsense routine looks something like this:
- Figure out what the higher timeframe is doing.
- Spot the most obvious, aggressive recent move.
- Draw your Fibonacci tool across that swing.
- Look left. Does that Fib level line up with any past support, resistance, or trendlines?
- Wait for the price to hit the zone and show a clear price action signal.
- Set your stop loss where the setup is factually broken—not where your wallet dictates.
- Know exactly where you’re taking profit before you even enter.
Follow that, and you keep Fibonacci in its lane. It’s there to help you nail your timing and visualize structure, not to think for you.
I highly recommend journaling your Fib trades. After a few months, you might realize you crush it when trading 38.2% pullbacks in blazing-fast trends, but you always lose money on deep 78.6% retracements. Your own track record will teach you way more than any trading book ever could.
The Human Side of Trading Fibonacci
The thing that makes Fibonacci so attractive is exactly what makes it dangerous: it creates an illusion of order in a market that is fundamentally chaotic. Having those clean lines on your chart feels reassuring, but it can trick you into thinking the market is totally predictable.
Spoiler alert: it’s not.
You can have the most beautiful, textbook Fibonacci setup in the world, and it will still fall apart because a central bank chief sneezed, a news headline broke, or a large hedge fund decided to dump their position. Forex is a living, breathing thing. No tool changes that.
But the point of trading tools isn't to erase uncertainty. It’s to help you manage it.
And that’s where Fibonacci shines. It forces you to be disciplined. It gives you a reason to sit on your hands and wait. It transforms your internal monologue from "Man, I hope this keeps going up" into "I will wait for the price to reach this specific zone, and if I see buyers step in, I’ll take the trade."
It’s not sexy, but that’s the kind of cold, calculated thinking that keeps you in this game long-term.
Decide where the swing begins before seeing the reversal
Take a hypothetical rise from 1.0800 to 1.1000. A 50% retracement lies at 1.0900, and a 61.8% retracement lies near 1.08764. The arithmetic is straightforward. The difficult decision is whether those were the appropriate swing points and what would justify acting when price reaches either level. Also note that 50% is a common retracement convention, not a Fibonacci ratio itself.
A chart can contain several plausible swings. Selecting whichever one produces the neatest reaction after the fact creates a misleading impression of precision. Define how you choose the swing in advance, including the timeframe and what confirms the high and low. Keep failed reactions in the record alongside the attractive examples.
Additional indicators do not necessarily provide independent confirmation. A moving average, a retracement, and a previous price level may all be describing aspects of the same recent move. Their agreement can be useful context without multiplying the evidence as much as three separate labels suggest.
For a test, specify an entry rule, an invalidation point, and an exit rule, then include costs. Compare the result with a simpler setup that omits the Fibonacci level. That comparison asks whether the extra rule contributes something measurable. A reference point can be convenient without being predictive, and discovering that distinction is a useful outcome of testing.
The drawing must come before the outcome
A Fibonacci study is hard to evaluate when the anchor points keep moving until the chart looks convincing. Decide how a swing is identified, when it becomes observable, and which retracement levels matter before looking at the next move. Record cases that fail as well as those that react neatly. The question is whether the complete rule improves decisions, not whether a line can be placed near a turning point afterward. 1, 2
A Few Closing Thoughts
Fibonacci isn't about slapping colorful grids on your screen. It’s a masterclass in patience. It’s about waiting for the market to come to you instead of blindly chasing green candles. It’s about taking trades where the risk makes sense, not where your FOMO is peaking.
That’s why the tool has survived for so many decades. Not because it’s magic, but because it gives traders a highly practical way to visualize pullbacks, plan for continuation, and manage risk.
If you're going to use it, use it right. Draw it over obvious swings. Hunt for confluence. Wait for a trigger. Accept that you’re still going to lose some trades. And whatever you do, never let a static line on a chart override what the live price action is screaming at you.
Do these things, and Fibonacci stops being just another useless indicator and becomes an actual framework for reading the market's rhythm. Treat it as a measuring tape, not a crystal ball. Wait for evidence at your zones, record your results, and keep your risk tight. The moment you start treating these levels like guarantees, you’ve lost. But if you treat them as areas of high probability, they might just change the way you trade forever.
Sources and further reading
- CFTC: Eight things to know before trading forex
- BIS: April 2025 FX turnover, September 2025 preliminary release
Editorial revision: 7 October 2026. Numerical scenarios are hypothetical unless identified as historical. References support the added explanations and selected corrections; rules and product terms should be checked again before acting.