
Order flow refers to trading activity and orders, but the phrase is also used loosely for chart interpretations that do not contain direct order data. In spot forex, the market is fragmented, so a broker's feed or a venue's book is only a partial view. Smart money concepts add a framework for interpreting price behavior; they do not automatically reveal who traded or why.
Why Traditional Retail Trading Often Feels Incomplete
Most of us were taught to trade using rigid rules. Support and resistance are solid lines, trendlines are boundaries, double tops mean sell, and double bottoms mean buy.
Those tools aren't useless, but they only tell half the story. They show you where the price reacted in the past. What they don't tell you is why it might go back there, what kinds of orders are resting there now, or if a sudden move toward that level is just a trap to drum up liquidity before a reversal.
A pattern can fail even when it is easy to recognize. Orders may cluster near obvious levels, but that does not establish why a particular trade lost. Test the setup, costs, and exit rules before concluding that visibility itself caused the failure.
Once you view the market through that lens, everything shifts. Lines on a chart stop being invisible walls and start looking like active zones where big money is waiting to change hands.
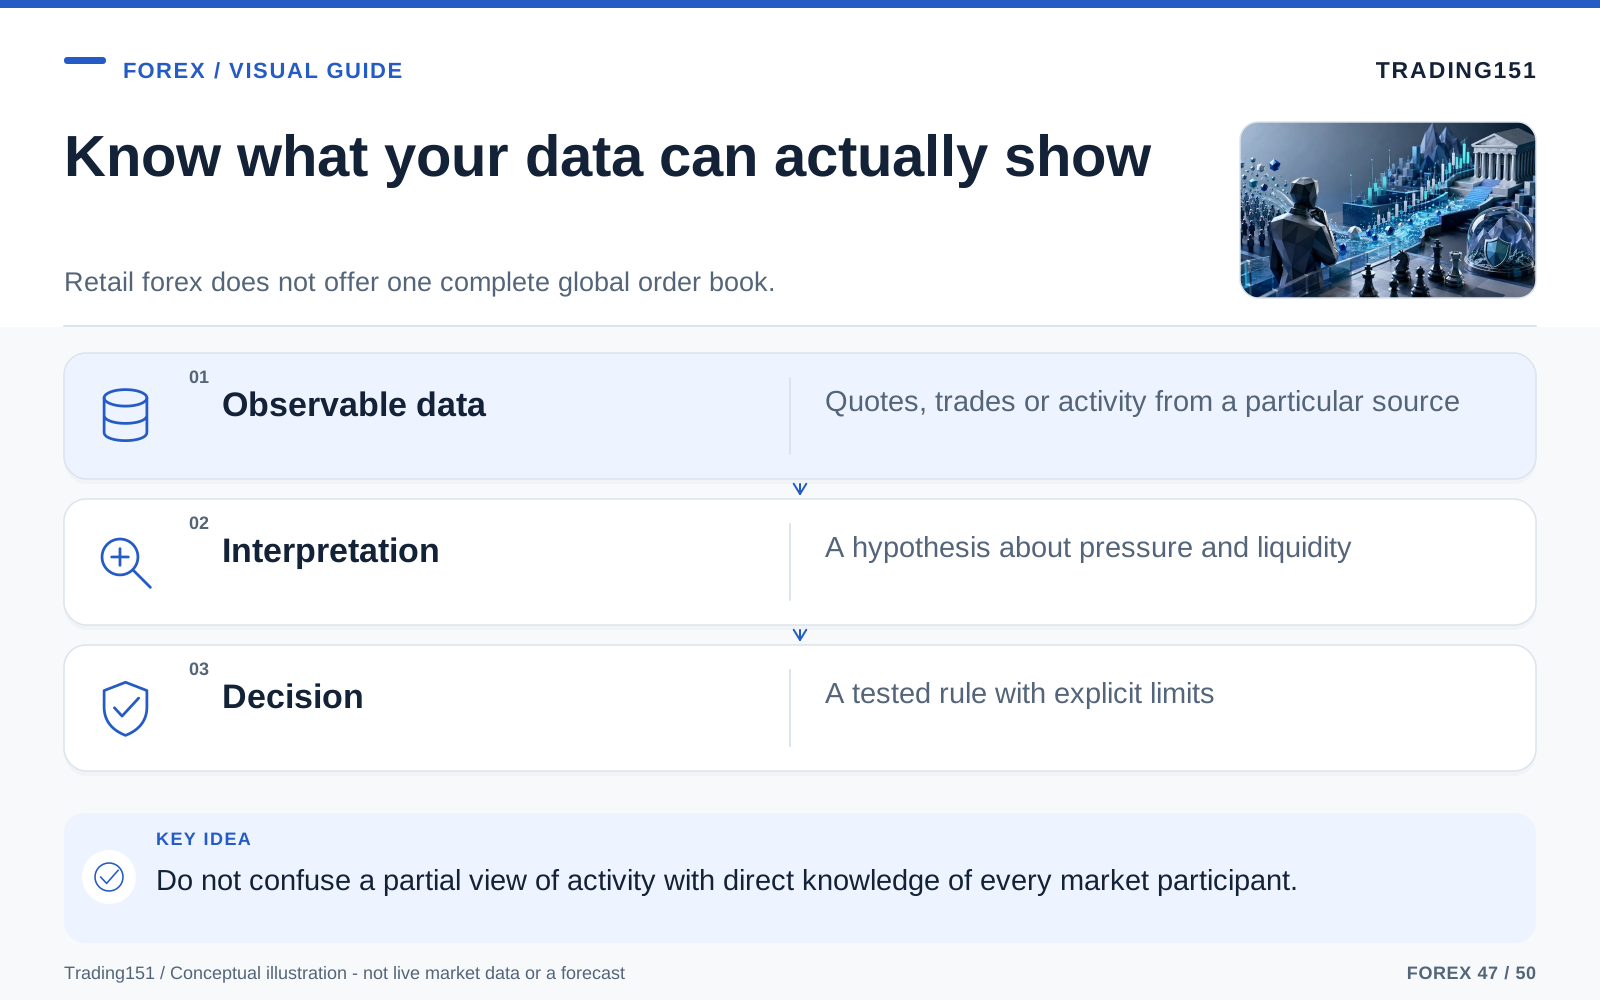
Read this diagram as text
- Observable data
- Quotes, trades or activity from a particular source
- Interpretation
- A hypothesis about pressure and liquidity
- Decision
- A tested rule with explicit limits
Who or What’s “Smart Money”?
The phrase smart money gets thrown around so much on trading forums that it sounds like some secret society. In reality, it’s just a shorthand for the market's heavyweights: central banks, hedge funds, institutional trading desks, proprietary firms, and major liquidity providers.
They don’t have a crystal ball. They don't magically know the future. What separates them from us is scale, access, and the need for large execution.
If you or I want to buy a standard lot of EUR/USD, we click a button and get filled instantly. An institution trying to move hundreds of millions of dollars can’t do that. For every buyer, there has to be a seller. If they just dump a large order into the market all at once, they’ll cause extreme slippage and ruin their own entry price.
SMC interprets some price movements through institutions' need to execute large orders. That is a model of possible behavior, not direct evidence that an institution sought a particular cluster of retail stops. Institutions differ in objectives, and a price chart does not reveal their complete orders.
The decentralized FX market contains many participants and venues. A marked liquidity area may attract activity, but price has no obligation to travel there. News, changes in quotes, hedging, and other flows can move it elsewhere.
What Order Flow Really Means in Forex
Order flow concerns orders and trading activity, including how aggressive transactions interact with available quotes. A price chart is an outcome of that activity, not a complete record of all submitted, cancelled, or executed orders.
If you were trading futures in a centralized market, you could watch this happen on a Level 2 order book or a footprint chart. Forex is different. Because the spot FX market is completely decentralized, retail traders don't get a master feed of every transaction across the globe.
Retail chart-based interpretations often infer activity from price changes rather than observing a consolidated institutional order record. Some feeds provide real venue-specific transaction or order-book information, but that information still covers only its stated source. Label the data and its limitations before drawing a conclusion.
You aren't watching the footprints being made in real time—you are tracking where the beast just walked.
SMC can provide a vocabulary for organizing chart observations. Its predictive usefulness must be tested, and it should not be presented as a way to identify exact hidden interbank orders from ordinary candles.
The Core Idea: Price Moves Toward Liquidity
Visible highs and lows are candidate areas of trading interest, not destinations that price is required to seek. Orders may activate there, but their quantity and ownership are uncertain without suitable data. A strategy needs an explicit response for a reversal, a continuation, and no interaction with the level at all.
In practical terms, liquidity sits wherever large clusters of orders are resting. You’ll typically find it at:
- Stop losses below obvious lows
- Stop losses above obvious highs
- Breakout orders above resistance
- Breakdown orders below support
- Clusters of pending orders around well-known technical levels
When orders activate near a level, trading activity and price impact can increase. That does not establish that an institution received a desired quantity or that a reversal must follow. Distinguish the observed burst of activity from the story used to explain it.
This explains those annoying, recurring market behaviors:
- Price breaks above a clean, obvious high, then aggressively dumps.
- Price wicks just below major support, takes out everyone's stops, and then rallies to the moon.
- A breakout looks strong for about ten minutes before completely collapsing.
Those patterns can be described without assuming deliberate manipulation. The trader's task is to test whether a consistently defined event changes the odds enough to cover costs and losses, not to assign intention to the market.
The Building Blocks of Smart Money Concepts
The vocabulary describes selected price patterns and interpretations of liquidity. It does not directly show how every large participant entered or exited. Keep that distinction visible when turning the terms into trading rules.
1. Liquidity
As we just covered, liquidity is the fuel. Without it, the big players can’t move their money efficiently.
Most retail traders naturally flock to the same spots because we're all reading the same books. Put your stop below the swing low. Sell the double top. Buy the breakout. It makes sense, and sometimes it works beautifully. But when the crowd piles into the same levels, they become prime targets.
That’s why you’ll hear SMC traders obsess over equal highs and equal lows. They aren’t just pretty chart patterns. They are giant, flashing neon signs that point to large clusters of stop-losses.
Think of liquidity like a magnet. Price might ignore it for a while, but eventually, the market will get pulled back toward those areas to clear out the resting orders before making its next major move.
2. Market Structure
You wouldn’t drive in a new city without a map, and market structure is your map for trading.
At its core, an uptrend is a series of higher highs and higher lows. A downtrend is lower lows and lower highs. SMC traders watch like hawks to see exactly where that rhythm holds up, and where it breaks.
- Break of Structure (BOS): This means the trend is continuing. Price pushed past an old swing point in the direction of the trend, proving momentum is still alive.
- Change of Character (CHoCH): This is your early warning radar. It's the first real signal that the current trend is exhausted and might be reversing.
It sounds like basic stuff, but ignoring structure is how people blow accounts. They’ll spot a beautiful order block and try to buy it while the market is in a screaming downtrend. Context is everything. A setup means absolutely nothing if the broader market is trying to do the exact opposite.
3. Order Blocks
Order blocks are probably the most hyped—and most misunderstood—part of SMC.
Simply put, an order block is the last candle (or group of candles) that went against the trend right before a large, structure-breaking move.
- Bullish order block: The last down-candle before price violently exploded upward.
- Bearish order block: The last up-candle before price aggressively tanked.
The theory here is that this specific zone is where institutions quietly accumulated their positions before placing the trade. Because big players often leave "unfinished business" behind, they tend to drive price back to these zones later to mitigate (or break even on) their remaining orders before continuing the move.
The trap? Traders start seeing order blocks in every candlestick. Not every little pause on a chart matters. A true order block needs to be backed by heavy momentum, a clear break of structure, and a narrative that makes sense.
4. Imbalance and Fair Value Gaps (FVGs)
When the market moves violently, it doesn’t always trade cleanly. Sometimes, the buying or selling pressure is so intense that the price skips right over levels, leaving a gap where barely any trading happened. In SMC, this is called an imbalance or a Fair Value Gap (FVG).
The market hates a vacuum. It has a natural tendency to eventually circle back and "fill" these inefficient zones. For a trader, these gaps act like magnets. Price will often retrace right into an FVG, fill the empty space, and then bounce back in the original direction.
But just like order blocks, you can't trade them blindly. FVGs are highly effective when combined with:
- The overall directional bias
- A recent liquidity sweep
- A strong order block
- A structural shift on a lower timeframe
Used on their own? They’re unreliable. Used in context, they become a large edge.
5. Premium and Discount
This is a simple but powerful concept. SMC traders essentially slice a price range in half:
- Discount: The lower half of the range, where you want to look for buys.
- Premium: The upper half of the range, where you want to look for sells.
Think of it like shopping. If you're bullish, you don't want to buy after the price has already surged (premium). You want to wait for a pullback to get a good deal (discount). It forces you to be patient and stops you from emotionally chasing large green or red candles.
6. Displacement
Displacement is the market screaming its intentions at you. It’s a fast, aggressive, high-momentum move that shatters previous structure and leaves large imbalances behind.
If price slowly drifts back to a level, that's one thing. But if it violently rejects a level and explodes in the other direction, that’s displacement. It’s the ultimate footprint of institutional money stepping in and taking control.
In a solid SMC setup, displacement is the clue that proves a zone is valuable, rather than just a random area on the chart.
Why Forex Traders Need Context More Than Vocabulary
The biggest trap in the SMC community is getting obsessed with the terminology while ignoring actual price action. You can plaster your chart with abbreviations—BOS, CHoCH, FVG, OB, liquidity, inducement—and still have absolutely no clue what the market is doing.
Anyone can find a perfect setup in hindsight once the move has already happened. The real skill lies in building a narrative in real-time. You have to clearly define your rules: What exactly counts as displacement? How much structure needs to break? What completely invalidates your trade? Clear rules make your trading repeatable; loose rules just make you good at telling stories about past charts.
Start asking yourself better questions:
- What is the higher-timeframe trend doing?
- Where is the nearest pool of obvious liquidity?
- Did price just sweep a major high or low?
- Did it violently reject that sweep with real displacement?
- Is price returning to the exact level that caused the move?
- Am I trading with the market's momentum or fighting it?
The labels don't make you a better trader. Understanding how the pieces fit together does.
A More Realistic Example of How a Setup Forms
Let’s walk through a practical scenario. Say GBP/USD is clearly bullish on the 4-hour chart. It’s making higher highs and higher lows, and it just blasted through a major resistance level. Your bias is set: you want to buy.
You drop down to the 1-hour chart and spot a very clean, obvious short-term low. Retail traders are likely buying there, treating it as solid support. Just beneath that low is an area where price previously exploded upward, leaving a bullish order block and a large Fair Value Gap behind.
You don’t do anything yet. You sit on your hands.
Price begins to fall. It slices right through that obvious support low, stopping out all the early retail buyers. Breakout traders start shorting, thinking the market is crashing. But instead of accelerating downward, the price taps into your order block and suddenly prints a large, aggressive bullish candle on the lower timeframe.
That sudden momentum shift tells you the trap is sprung. The buyers are stepping back in.
Now, look at the evidence you've stacked up:
- The higher-timeframe trend is bullish.
- The weak retail liquidity below the low was swept.
- Price hit a high-probability zone (the order block).
- The lower timeframe showed aggressive buyers stepping back in.
That is a dramatically better trade than just blindly buying a line on a chart. You place your stop-loss just below the invalidation point, and target the next obvious liquidity pool above, like old equal highs.
Notice the shift here? You aren't just trading a shape anymore. You're trading a sequence of events.
Sessions, Timing, and Why the “When” Matters
Location on a chart is huge, but timing is just as critical.
The Forex market doesn't behave the same way 24 hours a day. Asian, London, and New York sessions all have completely different rhythms. The most violent, aggressive liquidity sweeps usually happen right when the major sessions open and a flood of real volume hits the tape.
If you see a picture-perfect order block get hit during the deadest part of the day, it might not mean much. But if price sweeps a major low right as the New York session kicks off? That’s a setup with actual institutional participation behind it.
This is why context matters so much. A mediocre setup at the right time of day is often far better than a "perfect" setup during a completely dead market.
The Psychological Shift That Makes SMC Useful
Ultimately, the biggest benefit of learning order flow isn't the fancy words. It’s the way it rewires your brain.
Most retail traders trade purely on emotion. A giant green candle makes them feel like they're missing out, so they buy the top. A fast red candle terrifies them, so they panic sell. Breakouts look tempting because the momentum feels so obvious.
Order flow trains you to think backward. When a move looks a little too obvious, you learn to ask, "Is this the real move, or are they just grabbing liquidity first?"
It forces you into a disciplined, patient mindset that usually feels uncomfortable at first:
- You learn to wait instead of chasing.
- You let the market sweep a level rather than jumping in too early.
- You look for confirmation after the trap, not during it.
- You accept that the absolute best trade entries rarely feel safe or obvious in the moment.
This is why so many traders fall in love with SMC. It explains why patience pays off, and it stops you from treating every big candle as an invitation to gamble.
Common Mistakes Traders Make With Smart Money Concepts
As great as SMC is, people mess it up constantly. Hindsight is the biggest trap of all. When you look at old charts, the sweeps, blocks, and targets look beautiful. A real test is hiding the future candles and making your decisions in real time. Here are the most common pitfalls to avoid:
Turning Every Candle Into a Signal
Once you learn SMC, it’s tempting to draw boxes around every candle. Suddenly, your chart is a mess of lines and labels. If you mark every tiny pause as an order block, you’re just creating noise. Be selective. Only trade the zones that caused large displacement and broke real structure.
Ignoring the Higher Timeframe
You can find a gorgeous 5-minute setup, but if it’s fighting a large daily downtrend, it’s going to fail. Too many bad trades happen because people get tunnel vision on the lower timeframes and forget the broader market is moving the other way.
Entering Before the Liquidity Is Taken
This is heartbreaking. You find the perfect zone, but you enter too early. The market drops just low enough to hit your stop, sweeps the liquidity, and then goes exactly where you predicted. The zone wasn't wrong, but your timing was. Wait for the sweep.
Believing SMC Is a Guaranteed Edge
SMC is not a cheat code. Order blocks fail. FVGs get ignored. Liquidity sweeps sometimes turn into large trend continuations. It’s a framework that improves how you read the market, but it doesn't make you invincible. You still have to manage your risk and accept losses gracefully.
Forgetting That Forex Is Decentralized
Again, we aren’t reading the actual interbank order book on a retail chart. Much of what we call "order flow" in spot FX is an interpretation of price action. Stay humble. You're reading clues, not mind-reading the banking system.
Risk Management Still Decides Whether You Survive
Because SMC explains a lot of "mysterious" market behavior, traders often develop a god complex. They think they’ve cracked the code, which creates a dangerous illusion of control.
But your survival in the markets still comes down to the boring stuff:
- Putting a hard stop-loss exactly where your idea is invalidated.
- Risking a sensible, calculated amount per trade.
- Walking away instead of revenge trading after getting swept.
- Accepting missed trades without chasing the very next candle.
- Treating setups as probabilities, not absolute promises.
The best SMC traders aren’t the ones with the most beautifully labeled charts. They’re the ones who read context clearly, wait patiently, and manage their risk without the drama.
So Is SMC Better Than Traditional Technical Analysis?
People ask this all the time, but it’s the wrong question.
SMC didn’t reinvent the wheel. It’s essentially just a more detailed, logic-based layer placed over traditional price action and market structure. A support level is still support. A trading range is still a range. The trend still matters.
SMC just asks you to dig one layer deeper. Instead of simply saying, "Price bounced here before," it asks, "Why did it bounce, whose stops are resting below it, and how can I use that to get a safer entry?"
This is why many seasoned traders blend both approaches. They use classic technical analysis to map out the big picture, and SMC to snipe their entries. Don't be tribal about the labels. The only thing that matters is understanding price action more clearly.
Separate actual order data from a chart-based interpretation
Ask what the data actually measure. Executed volume on a particular venue, displayed resting orders, a broker's customer positioning, and tick counts are different datasets. Each may be useful for a defined question, but none should be relabeled as the complete global forex order flow.
Even a genuine order book has limits. Displayed orders can be changed or canceled, and some liquidity may not be visible in advance. The existence of an order does not prove it will remain available when price reaches it. Historical snapshots can also miss the sequence of updates that shaped an execution.
Chart-based concepts require a separate test. A break of structure or a sweep of a previous high can be specified as observed price behavior. Claims that the move exposes an institution's plan need additional evidence that the candle itself generally does not supply. Keep the observation and the explanation distinct in both the journal and the strategy rules.
Choose the dataset that fits the instrument being traded, document its limitations, and evaluate whether it adds value beyond price alone. A partial view can still be useful when its boundaries are understood. It becomes misleading when precision in the display is mistaken for completeness of information or certainty about the next move.
Keep venue data within its scope
An order book or transaction feed can provide useful evidence about the market it covers. It does not automatically represent every dealer, venue, or customer in global FX. Quote changes, hidden liquidity, and activity elsewhere may remain outside the view.
Label the source and instrument when using such data. A currency-futures feed may help investigate related activity without being identical to the spot market traded in another account. The more precise the claim, the more important the coverage becomes. Calling a display 'order flow' should not hide the difference between observed transactions, displayed orders, and interpretations drawn from candles. 1, 2
Final Thoughts: Learn to Read the Story, Not Just the Pattern
For a lot of traders, learning order flow and SMC feels like finally getting a peek behind the curtain. All those frustrating stop-hunts, fake-outs, and bizarre market reversals suddenly make a lot more sense.
That perspective alone is priceless. Instead of feeling like the market is personally attacking you, you begin to see how obvious retail positioning sets the table for the larger players.
But the real magic happens when you stop looking at charts as static pictures and start reading them as dynamic, moving stories.
Where is the resting liquidity? Who just got swept? Did the market reject a level with real intent, or was it just noise? Have we broken structure, or are you just trying to force a reversal? These are far better questions than just asking if a line held or broke.
Is SMC the ideal? No. It won't fix bad discipline, and it won't prevent you from taking losses. But it will fundamentally sharpen your understanding of how price behaves around major levels, and it will prove to you why patience always pays more than impulsiveness.
Once you flip that mental switch—from simply asking where the price is, to asking why it's there—your trading will never be the same. Keep your rules strict, manage your risk, and let the market show its hand before you play yours.
Sources and further reading
- BIS: April 2025 FX turnover, September 2025 preliminary release
- CFTC: Eight things to know before trading forex
Editorial revision: 7 October 2026. Numerical scenarios are hypothetical unless identified as historical. References support the added explanations and selected corrections; rules and product terms should be checked again before acting.