
ICT is a trading framework associated with Michael Huddleston, who publishes under the name Inner Circle Trader. It uses concepts such as liquidity, market structure, and fair value gaps to interpret price charts. Those labels should not be confused with verified information about institutional orders or intentions. The useful question is whether a precisely defined setup performs after realistic costs, not whether a chart can be given a convincing explanation afterward.
The Core Philosophy: Price Moves Where Orders Are
To really get ICT, you have to stop looking at your chart as a random series of candlesticks. The traditional retail trading textbook says price goes up because there are more buyers, and down because there are more sellers. That’s true, but it’s only half the story. It tells you what is happening, but it completely fails to tell you where the market is headed next.
ICT flips this around. It assumes the market is always seeking out liquidity. In plain English? Price is magnetically drawn to areas where a large amount of orders are resting. Usually, that’s just above obvious highs, right below obvious lows, or packed tightly around support and resistance levels that everyone is staring at.
Think about it from the perspective of a large institution. Large players can’t just click "buy" and enter a large position like you or I can. They need counter-parties. They need a large pool of orders to absorb their trades without moving the market too much against themselves. That’s why you so often see price break an old high, trigger a bunch of breakout buyers, hit the stop-losses of short sellers, and then instantly reverse. It’s not the market being evil or chaotic. It’s the market grabbing the liquidity it needs before making its real move.
In ICT circles, you'll hear this referred to as the Interbank Price Delivery Algorithm (IPDA). Whether you believe there's a master algorithm controlling the markets or you just view it as a helpful mental model for crowd behavior, the takeaway is exactly the same: stop obsessing over the color of the current candle, and start asking yourself where the resting orders are.
That one mindset shift is huge. Instead of getting FOMO and chasing a large green candle, you pause and ask if price is just sweeping buy-side liquidity before dumping. Instead of panic-selling a sudden drop, you look to the left and wonder if the market is just clearing out sell-side stops before a rally. The chart stops looking like noise and starts looking like a game of chess.
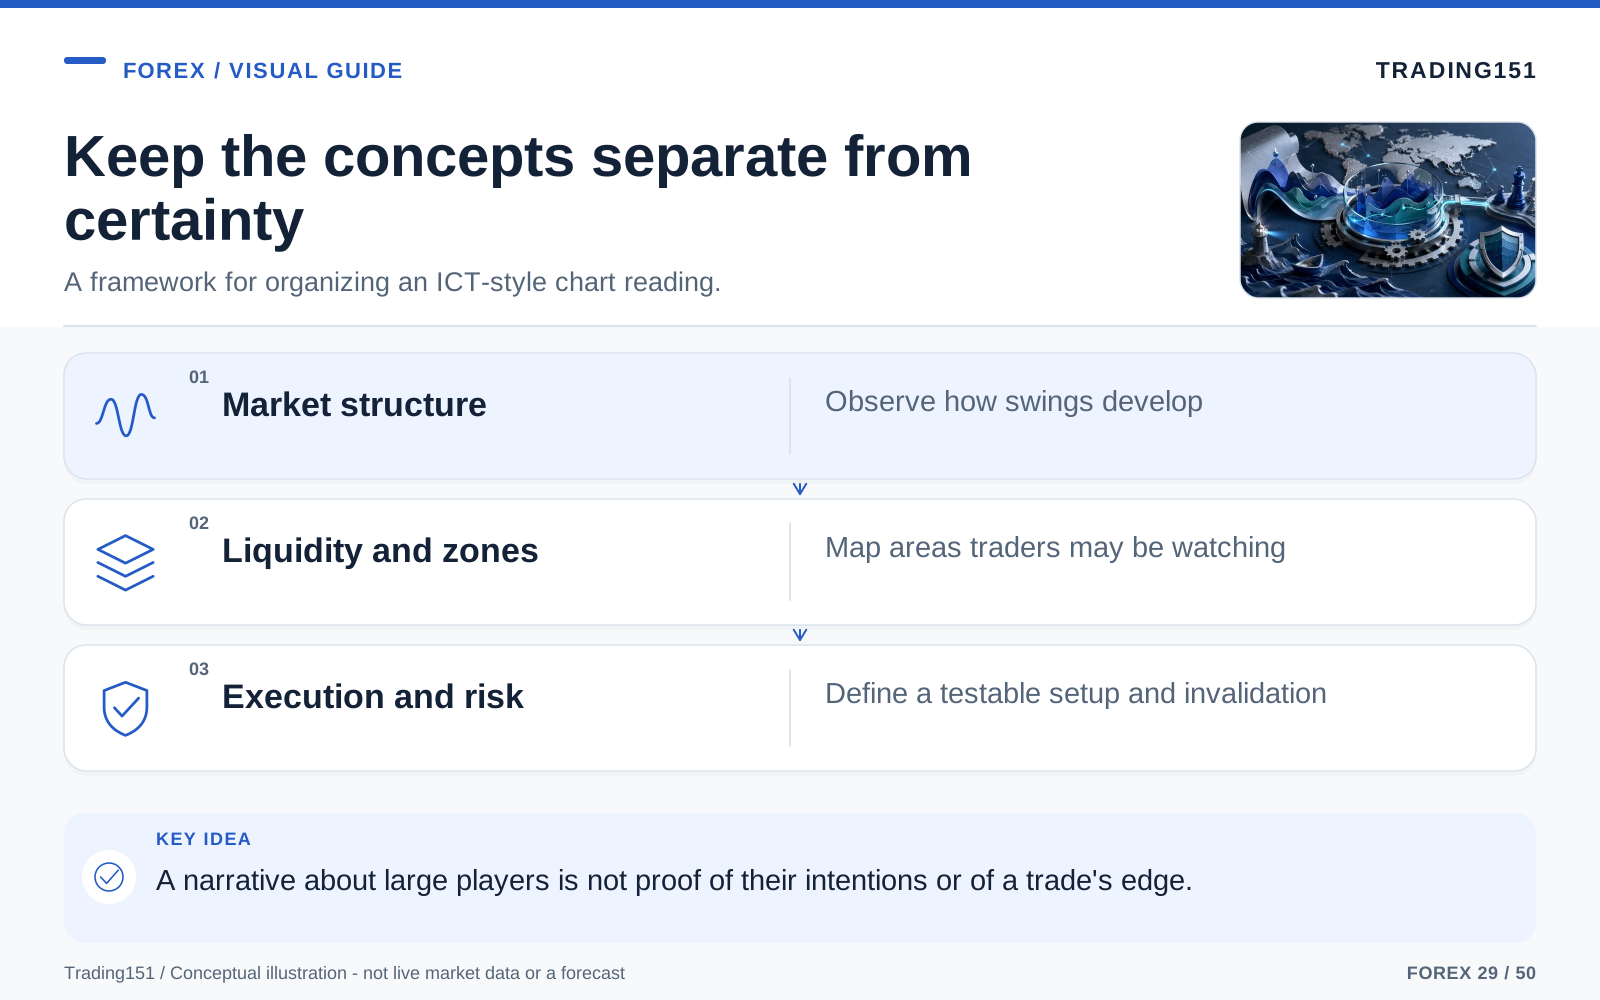
Read this diagram as text
- Market structure
- Observe how swings develop
- Liquidity and zones
- Map areas traders may be watching
- Execution and risk
- Define a testable setup and invalidation
The Vocabulary of “Smart Money”
The biggest hurdle with ICT is definitely the vocabulary. Thankfully, you don't need a dictionary to grasp the basics. A few core concepts do 90% of the heavy lifting. Try to remember that terms like fair value gap, liquidity pool, or market structure shift are just ways to describe what price is doing—they aren't magical proof of "smart money" at work. Translating the jargon into plain, visible chart patterns makes everything much easier to test. If a rule is so vague that two traders can't agree on it, it's not a reliable trading rule.
1. Liquidity: The Fuel Behind the Move
Liquidity is the lifeblood of this entire methodology. In trading terms, it just means "where the orders are." That includes stop-losses, pending breakout orders, and buy or sell stops.
- Buy-Side Liquidity (BSL): This piles up above old highs, equal highs, or obvious resistance lines. Short sellers put their stops here, and breakout traders put their buy orders here.
- Sell-Side Liquidity (SSL): This clusters below old lows, equal lows, or obvious support. Long traders hide their stops here, and breakdown sellers wait to jump in here.
If you’ve ever bought a picture-perfect breakout only to watch price instantly collapse against you, you’ve been the victim of a liquidity grab. Retail traders call it a fakeout or a false breakout. ICT traders see it as intentional: the market raided that level to fill large orders, then took off in its true direction.
This is a large mental shift. Those obvious highs and lows on your chart? They aren't brick walls of support and resistance. They are targets. They attract price because that's where the money is sitting.
2. Displacement: The Footprint of Real Intent
Not all price movement is worth your attention. A lot of the time, the market just drifts or chops around aimlessly, wasting your time. Displacement is the exact opposite. It’s an aggressive, undeniable move that screams, "We are going this way now."
You know displacement when you see it. It’s fast, heavy, and breaks through previous structure with violence. It covers a lot of ground in a few candles and usually leaves gaps in the price action. There is zero hesitation.
This matters because you don't want to risk money on weak signals. A lazy, choppy break of a level is a trap waiting to happen. But a displaced break tells a totally different story. It shows that heavy volume has stepped in and the market isn't just ranging anymore.
3. Market Structure Shift (MSS): The Turning Point
Markets move in rhythms. Uptrends make higher highs and higher lows; downtrends do the reverse. A Market Structure Shift is exactly what it sounds like—the moment that rhythm aggressively breaks.
Picture this: price has been grinding up all morning. It pops above a previous high, but instead of continuing, it suddenly dumps hard, smashing through a recent short-term low with serious displacement. That break is your MSS. It tells you the buyers have lost control and the tide is likely turning bearish.
For ICT traders, this sequence is everything. First, price sweeps liquidity (the fakeout). Then, it violently shifts structure (the MSS). A sweep without a shift is just a sweep. But when you get both? Now you have the makings of a high-probability trade.
4. Fair Value Gaps (FVGs): The Imbalance Price Often Revisits
If there's one ICT term you've probably heard, it's the Fair Value Gap, or FVG. The concept is brilliantly simple. When the market moves so violently in one direction that buyers and sellers don't get a chance to interact properly, it leaves an "imbalance" or gap on the chart. And price has a funny habit of coming back to fill that gap before moving on.
Visually, an FVG is a three-candle pattern. If it’s a bullish move, the low of the third candle doesn't touch the high of the first candle. That empty space in the middle is the gap.
Think of it like a painter missing a spot on the wall because they swung their brush too fast. Eventually, they have to go back and touch it up. In trading, that "touch up" is often your perfect entry, especially if the FVG lines up with a liquidity sweep and a structure shift.
Just don't make the rookie mistake of treating every FVG like a guaranteed bounce. Context is everything. An FVG floating in the middle of a choppy range is garbage. An FVG created by violent displacement right after a major liquidity sweep? That’s the one you want to watch.
5. Order Blocks: Where the Larger Move Started
In the simplest terms, an Order Block is the last opposite-colored candle before a large, impulsive move. If price suddenly explodes upward, an ICT trader will mark the last down-candle before that explosion as a bullish order block. If price drops like a rock, the last up-candle before the fall is a bearish order block.
ICT traders interpret an order block as a possible area of prior concentrated activity before a strong move. A candle alone does not establish that institutions accumulated there or will defend the level on a return. Treat the interpretation as a hypothesis to test, not as access to a bank's order records.
I'll be honest: order blocks are probably the most subjective part of ICT. Hand a chart to three different traders, and they might draw three slightly different order blocks. It takes screen time and intuition to get good at spotting the ones that matter. If you aren't careful, you'll end up drawing rectangles on every candle and paralyzing yourself.
6. Premium and Discount: Paying Too Much or Getting a Better Price
This is basically trading common sense, but ICT frames it nicely with premium and discount zones. Take a recent swing high and swing low, draw a Fibonacci tool from top to bottom, and find the 50% midpoint. The top half is premium (expensive). The bottom half is discount (cheap).
Within this framework, traders may prefer long entries in the lower half of a defined range and short entries in the upper half. Those are relative chart labels, not proof that the currency is economically cheap or expensive. Their usefulness depends on how the range is chosen and how the complete strategy performs after costs.
A filter can make a process more consistent without making it profitable. Record the trades the rule excludes as well as those it admits, and check whether the result survives different periods and reasonable changes to the chosen range.
Time and Price: Why the Clock Matters
Time of day can affect liquidity, spreads, and the release schedule, so it belongs in the trading rules. It does not follow that a trade at a particular hour must lose. Use a clearly defined time zone, account for daylight-saving changes, and test whether the chosen window improves results after realistic costs.
A setup that stalls during a quieter period may reflect limited activity, but the clock is not the only possible explanation. The entry rule, volatility, news, spread, and exit placement may also matter. A trading journal should record those possibilities instead of assigning every failed trade to the session.
ICT uses the term 'kill zones' for selected trading windows. Treat the claimed benefits of those windows as strategy-specific propositions, not a guarantee of peak volume or clean price movements on every day.
- London Kill Zone: The engine of early morning volatility, especially for EUR and GBP pairs. This is often where the high or low of the day is established.
- New York Kill Zone: The absolute heavyweight champion of trading windows, especially for USD pairs. This is where you see aggressive reversals or large trend continuations.
- London Close: A brief, specialized window that often triggers profit-taking and sharp, short-term reversals.
The exact hours vary slightly based on daylight savings, but the core lesson is what matters: stop trying to trade 24 hours a day. The market doesn't owe you a clean setup at 2:00 PM on a sleepy Tuesday. ICT forces discipline by telling you to only hunt when the fish are biting.
The Strategy in Practice: How the Pieces Fit Together
One commonly described sequence is a directional bias, a move through a prior level, a structure shift, a retracement, and a possible continuation. This is a framework for defining a setup, not an established ranking of the most reliable strategies. Specify each condition before testing so that the sequence cannot be reconstructed selectively after the outcome is known.
Let’s walk through a classic short setup on EUR/USD to see what this looks like in the wild.
Step 1: Establish the Higher-Timeframe Bias
Before you even look at a 5-minute chart, zoom out. Look at the 1-hour or 4-hour chart. What is the big picture doing? Is price slamming into a major daily resistance level? Is there a large pool of buy-side liquidity just sitting above last week's high, begging to be taken?
You need this context. Without a higher-timeframe narrative, you'll find yourself trying to trade every random twitch on the 1-minute chart, which is a fast track to a blown account.
Step 2: Wait for the Liquidity Sweep
Imagine EUR/USD spikes aggressively above a clean, obvious high that everyone has been watching. Breakout traders dive in, thinking it's going to the moon. Early short-sellers get stopped out. Retail sentiment turns massively bullish.
But as an ICT trader, you sit on your hands. You don't buy the breakout. You wait to see if this is a genuine move, or just a raid on liquidity. The real tell isn't what happens as price breaks the high—it's what happens right after.
Step 3: Watch for Displacement and a Market Structure Shift
Once that high is swept, does price stay up there? If it suddenly violently rejects and crashes down through a recent short-term low, you’ve got a Market Structure Shift. And if that drop is heavy, fast, and full of displacement? Now you’re in business.
The narrative is coming together: the market raided stops. Buyers couldn't hold the line. Sellers stepped in with serious firepower. The trend just flipped.
Step 4: Mark the Fair Value Gap or Order Block
That violent drop probably left a mess on the chart—specifically, a Fair Value Gap, or maybe a bearish Order Block near the top. This is your target zone for an entry.
This is where amateur traders screw up. They see the large red candle, panic that they're missing the move, and hit "sell" at the absolute bottom. An ICT trader does the opposite. They breathe, mark the FVG, and wait patiently for price to drift back up into that zone to rebalance.
Step 5: Enter on the Retracement
If the market pulls back into your FVG (ideally in a premium price zone), that's your trigger. You aren't guessing anymore; you're executing a calculated plan based on a specific sequence of events.
- Entry: Inside the FVG or at the bearish Order Block.
- Stop Loss: Tucked safely above the swing high that swept liquidity. If price goes back above that, your thesis is dead anyway.
- Take Profit: Aiming for sell-side liquidity down below—like previous daily lows or obvious support zones where retail stops are resting.
At that point, you aren't trading on hope. You're trading a repeatable sequence: raid liquidity, reject, break structure, retrace, continue. That sequence is the backbone of the ICT strategy.
A More Human Example of What This Looks Like
Let’s bring this down to earth. It’s a Tuesday morning in New York. The market is moving, and there’s a large, glaringly obvious high from yesterday. Every trader on the planet sees it. Price starts rallying toward it, and the hype builds. Financial Twitter goes crazy. Everyone is screaming breakout.
Price blows past the high. Breakout traders hit buy. Shorts get liquidated. But then, almost immediately, the market stalls out. Five minutes later, a large red candle absolutely destroys the previous support level.
At this exact moment, you have two types of traders.
The first trader is sweating. They bought the breakout, and now they’re stubbornly holding onto a losing position, praying it’s just a "pullback." They are trading purely on emotion and reacting to pain.
The second trader (you, hopefully) sees the matrix. Buy-side liquidity was swept. The breakout failed. We got a violent displacement down, causing a market structure shift. A clean fair value gap was left behind. Instead of panicking, you calmly set a limit order at the gap, define your risk, and wait for the market to come back to you.
That’s the true power of ICT. It takes the chaos and panic of the live market and filters it into a calm, readable sequence.
Why So Many Traders Find ICT Hard
It’s easy to read an article like this and think, "Wow, I'm going to be a millionaire by Friday." But —learning to execute this stuff live is difficult.
For starters, it's subjective. What exactly makes a "good" order block? Was that wick a true sweep, or just random noise? ICT isn’t like a moving average crossover where a robot can trade it. It requires discretion, and discretion takes months of screen time to build.
Second, the information overload is real. Beginners try to drink from the firehose. They chart out every imbalance, every order block, and every minor liquidity pool on a 1-minute chart. Their screen looks like a laser tag arena. The problem isn't that ICT lacks structure; it's that newbies try to use all of it at once.
Third, it requires severe patience. A good ICT setup is a rare beast. You might sit at your desk for an entire New York session and get absolutely nothing. If you are an adrenaline junkie who needs to be in a trade at all times, this method will drive you insane. It rewards the sniper, not the machine gunner.
Fourth, the entries feel concerning. Selling the market right after it printed a large green breakout candle feels fundamentally wrong. Buying when the sky is falling feels worse. ICT constantly asks you to fade the crowd's momentum, which goes against every emotional instinct you have.
Finally, the community can be toxic. A lot of ICT zealots act like this is the undisputed secret to the universe, and if you lose a trade, it's 100% your fault because you "misread the algorithm." Ignore that noise. No strategy has a 100% win rate. It’s just a framework for stacking probabilities in your favor. Period.
Where Beginners Usually Go Wrong
Most traders don't blow up because of one catastrophic error. They fail because of small, sloppy habits. The textbook examples on YouTube always edit out the choppy days, the messy price action, and the inevitable stop-outs. This tricks beginners into thinking the market will hand them a perfect setup every day. Spoiler alert: it won't.
The biggest rookie mistake is ignoring the higher timeframe. You might spot a flawless FVG on a 1-minute chart, but if the 4-hour chart is aggressively trending in the opposite direction, you are stepping in front of a freight train. Context is everything.
Another classic trap is forcing the setup. Once you learn what a liquidity sweep looks like, you start seeing them everywhere. Suddenly, every random wick is manipulation and every tiny pullback is an order block. When everything looks like a setup, you're just gambling.
Then there’s the issue of jumping the gun. People try to front-run the sweep instead of waiting for it to happen, or they enter the moment liquidity is taken without waiting for a structural shift to confirm the reversal. If you skip the confirmation, you lose the edge.
And, of course, the deadliest sin of all: chasing the candle. The market tanks, you panic that you missed the drop, and you sell at the bottom instead of waiting for the retracement into a premium zone.
Lastly, horrible risk management will destroy even the best ICT trader. It doesn't matter how pretty your setup is if you're risking 10% of your account on a single trade.
How to Start Learning ICT Without Losing Your Mind
If you want to master this, your goal shouldn't be to learn more concepts. It should be to learn a few concepts perfectly.
Strip it down to the studs. Forget the advanced variations for now. Just focus on liquidity sweeps, displacement, structure shifts, and FVGs. That is all you need to build a profitable foundation.
Date one market. Pick one asset—like EUR/USD or the S&P 500—and stalk it exclusively. Different markets have different personalities. If you bounce between crypto, gold, and forex, you will never develop the intuition required to read price action.
Master one session. Pick London or New York. Show up at the same time every day. Don't stare at the charts for 14 hours hoping for a miracle.
Backtest with the replay tool. Hindsight trading is easy; everything looks perfectly clear after the fact. Use your charting platform's replay feature to hide the right side of the screen. That's where you find out if you can spot the sweep and wait for the entry in real-time.
Journal everything. Take a screenshot of your chart before you enter and after you close the trade. Did you follow your rules? Your own data will teach you more than endless social media threads ever could.
Guard your capital. The edge in ICT comes from high risk-to-reward ratios, not from going all-in. Keep your risk to 1% or less per trade so you have the psychological space to let the strategy play out.
So, Is ICT Worth Learning?
Honestly? It completely depends on what you want from trading.
If you are someone who needs strict, black-and-white rules—like "buy when the blue line crosses the red line"—ICT will probably frustrate you to tears. There is too much gray area, too much nuance, and it relies heavily on your personal ability to read the context of the market.
But if you want to understand why the market does what it does... If you want to know why your obvious support level gets broken right before price reverses... Then yes, ICT is valuable. Even traders who hate the brand end up using its core concepts because they just make intuitive sense.
The true power of this strategy isn't that it gives you a crystal ball. It’s that it forces you to slow down. Instead of impulsively buying a green candle, you start asking the right questions: Where is the liquidity? Did we shift structure? Am I buying in a premium zone like a sucker, or waiting for a discount?
ICT won't magically make you disciplined. It won't cure your revenge trading. But if you have the patience to study it and the discipline to follow it, it offers an sharp lens through which to view the markets.
Turn the vocabulary into rules someone else could test
Take a claimed fair value gap. Specify the candle sequence, the exact boundaries, when the pattern becomes observable, and what counts as a revisit. Two traders looking at the same chart should be able to mark substantially the same setup without seeing the future. If the definition changes with each example, the result cannot be evaluated consistently.
Do the same for a liquidity sweep. A move beyond a prior high or low is observable. The claim that a particular institution deliberately engineered it to trigger retail stops generally is not observable from the candle alone. Keep the recorded price behavior separate from the story offered to explain it.
A useful test compares the full rule with a simpler alternative. Does the extra timing window or pattern filter improve results beyond an ordinary breakout or reversal rule? Include missed trades, failed examples, spreads, and plausible slippage. A handful of carefully selected chart screenshots cannot establish a repeatable advantage.
Treat paid education and performance claims with the same skepticism applied to any trading service. Clear definitions, complete records, and limitations are more valuable than claims of privileged insight into what banks are doing. It is possible to learn a useful way of organizing observations without accepting every explanation attached to it. That distinction keeps the analysis open to evidence.
Use the terminology without surrendering the test
A named framework can help traders discuss a setup, but its vocabulary should not shield the rules from scrutiny. Translate terms such as displacement, sweep, and structure shift into conditions that another person could identify on the same data. Where the definition remains discretionary, record that judgment explicitly. The test should evaluate the actual decisions being made, not an idealized version reconstructed from the best-looking charts. 1, 2
A Few Closing Thoughts
ICT is polarizing. It has a loyal following and an army of loud critics, and I get both sides. The terminology is unnecessarily dense, and the community can be exhausting to deal with. But if you brush all of that aside, the core philosophy is grounded: big money needs liquidity, and their hunt for that liquidity leaves footprints on your chart.
Once you learn how to spot those footprints, you will never look at a chart the same way again. A major high isn't just a line anymore; it's a target. A sudden drop isn't just volatility; it's displacement. A pullback isn't a reversal; it's the market rebalancing an inefficiency.
Does that mean you're going to win every trade? Not even close. Trading is still sharply hard.
But what ICT does best is teach you to sit on your hands and wait for the story to unfold. It stops you from treating every moving candle like a financial emergency. You don't need to believe in a secret, omnipotent banking algorithm to make money with this. You just need patience, strict risk management, and the discipline to let the market show its hand.
Sources and further reading
- CFTC: Eight things to know before trading forex
- BIS: April 2025 FX turnover, September 2025 preliminary release
Editorial revision: 7 October 2026. Numerical scenarios are hypothetical unless identified as historical. References support the added explanations and selected corrections; rules and product terms should be checked again before acting.