
Fundamental forex analysis examines economic conditions, policy, and other influences on currencies. Technical analysis studies market prices and related data to define patterns or trading rules. Neither supplies certainty, and combining them does not automatically create an edge. The useful question is what decision each method is intended to improve and how conflicting information will be handled before a position is opened.
Part 1: Fundamental Analysis – The Bigger Picture
Think of fundamental analysis as the study of why a currency is moving. You can't just collect economic data like trading cards; you have to figure out what matters right now. Sometimes inflation is the only thing the market cares about. A few months later, focus might completely shift to employment, economic growth, or political drama. The trick is figuring out what central banks are sweating over. If you know what policymakers care about, you can filter the news logically instead of treating every data drop like it’s life or death.
When a macro trader looks at a pair like EUR/USD, they aren’t just seeing letters and numbers on a screen. They’re sizing up two large economic systems. They’re asking if Europe looks stronger than the US, whether big institutional money is likely to flow into one region over the other, and if central bank decisions are about to tilt the scales.
The core idea is pretty straightforward: fundamental analysis treats a currency as the ultimate scorecard for a country's economic health and policy direction. A nation with high interest rates, solid growth, and safe returns naturally attracts global capital. A country dealing with stagnant growth, falling rates, or a chaotic government will struggle to keep its currency afloat.
In plain English? Fundamentals try to explain the actual story behind the price.
The Logic Behind Fundamental Trading
At its core, fundamental traders are chasing the answer to a really complex question: What should this currency be worth compared to that one?
This sends them down a rabbit hole. They care about central banks because interest rates dictate where big money flows. They care about inflation because it forces those central banks to act. They track wages, consumer spending, trade balances, and geopolitical tensions because they're building a case. Piece by piece, they are trying to figure out why one currency is primed to surge while another is ready to tank.
It’s rarely about predicting the exact moment a price will tick up or down. It’s more about understanding the underlying pressure. Which economy is heating up? Which central bank is about to catch the market off guard? Which country looks like the safest bet for investors over the next few months?
This is why macro trading appeals to people who need context. They aren’t satisfied just seeing a chart spike. They want to know who lit the match.
The Major Drivers Fundamental Traders Watch
1. Interest Rates
If the Forex market had a main character, it would be interest rates. Currencies live and die by the returns investors can get for holding them. When one central bank offers significantly higher rates than another, that currency acts like a magnet for capital. It doesn't mean the chart goes straight up without pulling back, but the magnetic pull is always there.
This is why traders obsess over the Federal Reserve, the European Central Bank, and the Bank of England. Sometimes the actual rate hike is what matters. Other times, the market ignores the hike but goes wild over a single sentence the bank's chairman says during a press conference. Central banks can leave rates entirely alone and still cause large market swings just by hinting at what they might do next year.
2. Inflation
Inflation sounds like dry economic theory until you realize it’s the steering wheel for monetary policy. If inflation runs hot, central banks are forced to hike rates (or keep them high). If it cools off, markets immediately start betting on rate cuts. This is why a simple inflation report can cause a currency pair to violently jump 80 pips in five seconds. Traders aren't reacting to the number itself—they're reacting to what that number forces the central bank to do.
And here is where it gets tricky: high inflation isn't always good for a currency, and low inflation isn't always bad. It's all about context. If inflation drops because the economy is naturally normalizing, that’s great. If inflation stays stubbornly high and chokes out businesses, it might spike the currency today but destroy it long-term. There are no easy "if X then Y" rules here.
3. Growth and Employment
Healthy economies create jobs, encourage spending, and keep businesses busy. That supports a currency because it proves the country can handle higher interest rates without collapsing. Think about the US Non-Farm Payrolls (NFP) report. The market doesn't just care about the raw number of jobs added; it cares about what those jobs say regarding wage inflation and the overall heartbeat of the economy.
GDP, retail sales, manufacturing indexes, and unemployment numbers all help answer the same burning question: is this economy growing, or is it just limping along?
4. Risk Appetite and Geopolitics
Not every market move is scheduled on an economic calendar. Sometimes, everything shifts because investors are simply scared. During times of war, pandemic, or financial panic, money floods into "safe-haven" currencies. When the panic fades and people feel greedy again, that money flows back into riskier, high-yield currencies. Market mood is a large driver. Sometimes, the most flawless economic theory gets completely bulldozed just because global risk sentiment flipped overnight.
What Fundamental Analysis Does Well
Where fundamentals really shine is in giving you a compass. It helps you answer big-picture questions like:
- Which currency in this pair is stronger right now?
- What is the main theme driving the market this month?
- Are institutions focusing on inflation, or have they shifted to worrying about a recession?
- Is the market already pricing in a future rate cut?
Having this perspective keeps you out of trouble. It stops you from buying every random chart breakout. A technical breakout backed by strong fundamentals is a high-probability trade. A technical breakout floating against the economic current is usually a trap. Knowing the difference is a superpower.
Where Fundamentals Frustrate Traders
Here’s the harsh truth that catches every beginner off guard: you can be 100% right about the economy and still lose money on the trade.
That’s not a glitch; it’s just how markets operate.
Fundamentals are great at telling you what should happen, but they are notoriously terrible at telling you when. You might correctly figure out that the US dollar is going to crush the Yen over the next two months. But if you buy in today, you might get stopped out three different times before the real move finally starts. Markets are messy. They front-run the news, they overreact, they panic, and sometimes a currency drops on "good news" simply because traders were expecting the news to be even better.
This is the psychological toll of fundamental trading. You will often be right in theory, but early to the party. And in trading, being early costs exactly as much as being wrong.
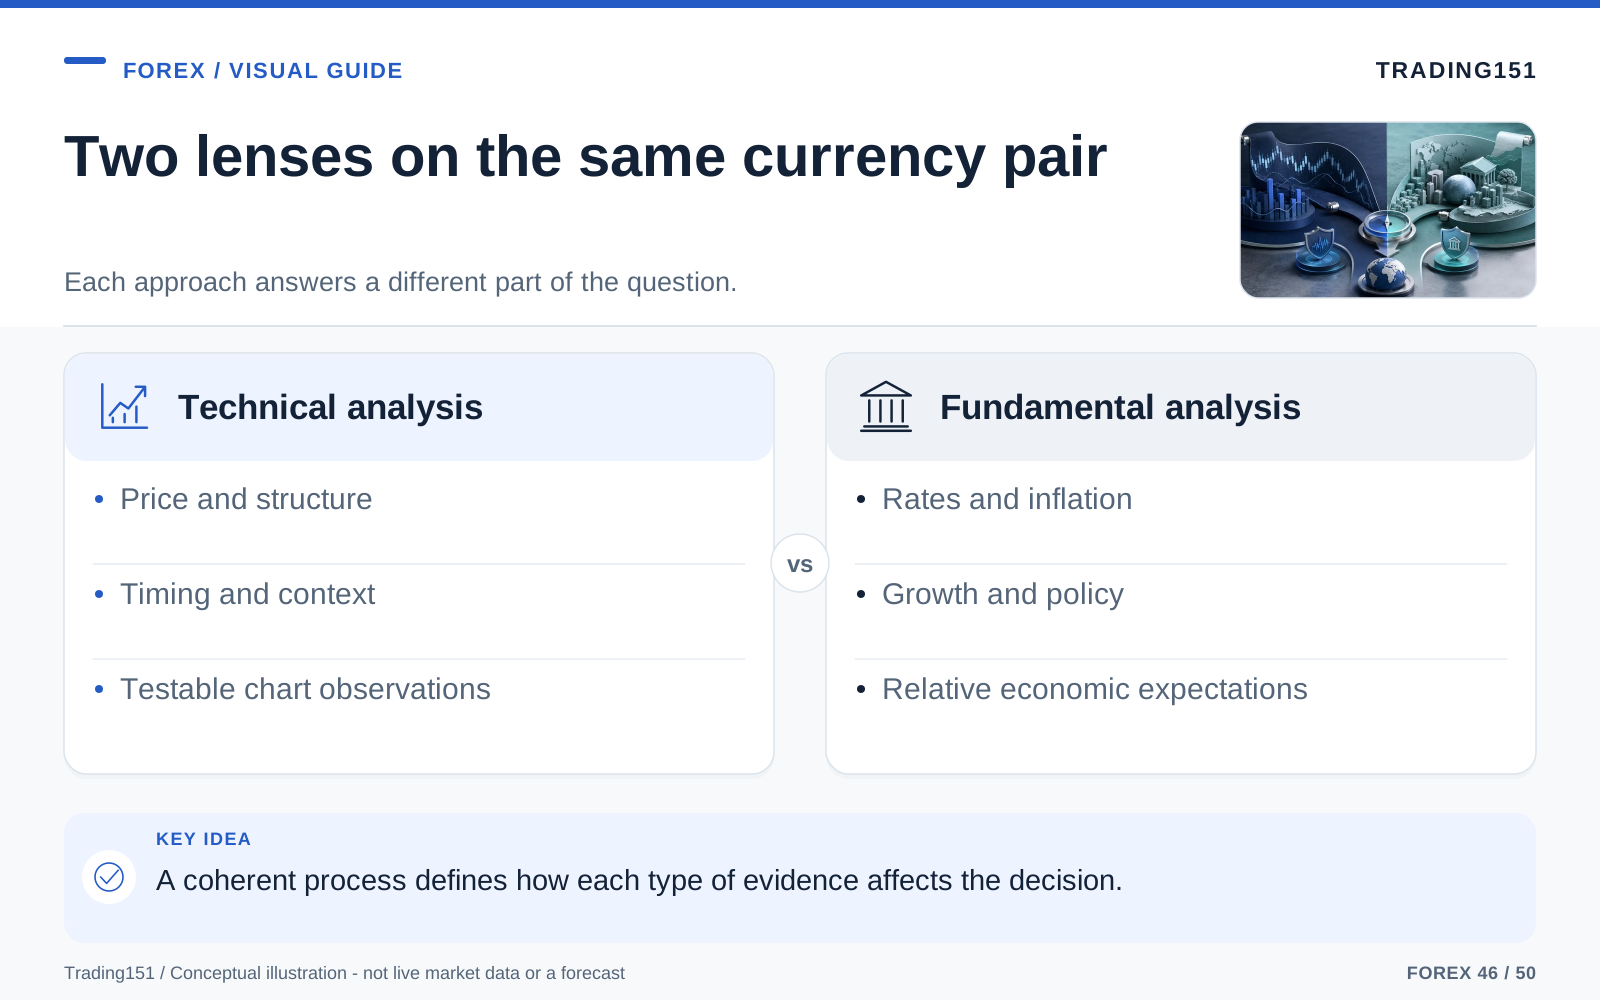
Read this diagram as text
- Technical analysis
- Price and structure; Timing and context; Testable chart observations
- Fundamental analysis
- Rates and inflation; Growth and policy; Relative economic expectations
Part 2: Technical Analysis – Reading the Market’s Behavior
If fundamental traders care about the story, technical traders care about how the market is behaving right now. To them, technical levels aren't magical invisible forcefields. They're just zones where human decisions tend to pile up. A prior high matters because traders remember it, pending orders are stacked around it, and it gives you a clear place to put your stop-loss. If that level breaks, it breaks. But the value is in watching how the market reacts when it gets there.
Technical traders study price, momentum, and crowd psychology. They don’t look at candlestick charts because they think the shapes have mystical powers. They look at them because every candle represents a very real tug-of-war between buyers and sellers. To a chartist, price action is hard evidence.
The fundamental belief here is simple: price discounts everything. Translation? Every piece of news, every rumor, every fear, and every central bank policy is already baked into the chart. By studying the footprints left by price, technical traders believe they can find an edge without needing a degree in economics.
The Logic Behind Technical Trading
It all boils down to human psychology. People are predictable when money is on the line. They chase green candles out of FOMO. They panic-sell at the absolute bottom. They take profits too early out of fear, and they freeze up when the market gets wild. If you put millions of people through that exact same emotional cycle, patterns inevitably start to form on the screen.
That’s what you're looking at when you study a chart. Not just lines and shapes, but human behavior repeating itself.
When a currency pair drops to a certain price and bounces three times in a row, that zone matters. When a market keeps making higher highs, it tells you exactly who is in control. When a large breakout immediately fails and crashes back down, that’s a story too. The charts are leaving footprints.
A pure technical trader couldn't care less if inflation is at 2.8% or 3.1%. They only care that buyers are aggressively defending a trendline, or that the market just rejected a level that looked painfully obvious to retail traders.
The Core Tools of Technical Analysis
1. Trend
Before you pull up a single indicator, and before you start drawing aggressive diagonal lines all over your screen, you have to answer the most basic question: is this market trending or moving sideways? A trend tells you who is driving the bus. Higher highs and higher lows? Buyers are in charge. Lower highs and lower lows? Sellers own the market. It sounds almost too basic, but you’d be amazed how many traders blow their accounts trying to short a raging bull market just because they want to look like a genius catching the top.
2. Support and Resistance
These are the battlegrounds. They matter simply because the market has a memory. If a pair reversed heavily at 1.1000 last month, traders are going to watch 1.1000 this month. Institutional algorithms place orders there. Retail traders put their stops there. Because everyone is looking at it, it becomes a self-fulfilling prophecy. Not because the line is sacred, but because human beings naturally organize around shared reference points.
3. Candlestick Behavior
Candlesticks usually get taught horribly. People try to memorize fifty different animal-themed pattern names and assume they’re cheat codes. They aren't. The real value is in what the candle tells you about conviction. A large wick at the bottom of a candle shows you that sellers tried to push the price down, and buyers violently slapped them back. A tiny, choppy candle after a large rally tells you the buyers are exhausted. You don't need to know the names; you just need to read the power dynamic.
4. Indicators
Indicators are fine, but they belong in a supporting role. Moving averages help you see the broader trend without getting distracted by daily chop. The RSI can warn you when a move is stretching too far, too fast. Fibonacci levels can highlight logical places for a pullback to end. But none of these are crystal balls. They just take old price data and run it through a math formula.
The danger kicks in when traders stack so many indicators on their screen that they can’t even see the candles anymore. One indicator screams "buy," another says "overbought," and a third says "trend over." Now your chart looks like a laser tag arena, your brain is fried, and you end up missing the trade entirely.
What Technical Analysis Does Well
Technicals are all about execution. They answer the nitty-gritty questions that fundamentals completely ignore:
- Where exactly is the safest place to enter this trade?
- At what exact price is my trade idea proven wrong?
- Is the momentum still strong, or is it dying out?
- Are buyers showing up at support like they're supposed to?
- Is this a real breakout, or a fake-out designed to trap late buyers?
This pinpoint accuracy is why day traders live and die by the charts. You can’t scalp the market based on a country's GDP growth. You need precise timing, specific locations, and a very rigid way to manage your risk when the market moves fast.
Where Technicals Fall Short
The downside? Technicals can easily be overused and totally stripped of context.
A picture-perfect chart pattern that you spent an hour analyzing can get completely wrecked by a random central bank tweet at 2:00 PM. A range might break not because of a technical catalyst, but because a large news story just broke. Or sometimes, a setup fails for the simplest reason of all: it looked too perfect, everyone and their mother took the trade, and institutional money decided to sweep all their stop-losses before moving the market.
There is also a large psychological trap here. Charts always look flawless in hindsight. When you scroll left, every bounce looks perfectly clean and every trend looks easy to trade. In real-time? It’s a mess. Price stalls. Wicks stab past your lines. Breakouts fail. You get stopped out by two pips right before the market goes exactly where you predicted. Technical analysis organizes the chaos, but it doesn't eliminate it.
Part 3: The Real Differences Between the Two
The easiest way to wrap your head around the two camps is to stop asking which one is "smarter." They are just tools designed to solve completely different problems. Fundamentals explain why a currency has underlying strength. Technicals tell you if today is a good day to buy it, and exactly where to place your stop-loss. Separating the "why" from the "when" is how you stop blaming the economy for a poorly timed entry.
1. They Play on Different Fields
- Fundamentals deal with reality: economies, policies, and actual money flow.
- Technicals deal with behavior: price action, timing, and market structure.
One builds the pressure. The other acts as the release valve.
2. They Work on Different Clocks
- Fundamentals are the ideal for swing traders and investors who are playing multi-week or multi-month trends.
- Technicals are the bread and butter for day traders and scalpers who need to get in and out with absolute precision.
That doesn't mean you can't use technicals for long-term investing, or fundamentals for day trading. It just means each style has a natural habitat.
3. They Break Down Differently
- Fundamental traders usually lose money by being too early, getting married to an economic theory, or raging when the market reacts illogically to news.
- Technical traders usually lose money by overtrading, falling for fake-outs, cluttering their charts, or ignoring large news events because "it wasn't in the chart."
Figure out how your favorite method is most likely to screw you over, and you're already ahead of 90% of retail traders.
4. They Attract Different Personalities
People hate admitting this, but trading is highly dependent on your personality.
Some people are storytellers. They love piecing together global events, reading the news, and understanding cause and effect. Other people are purely visual. They don't care about the news; they just want to see geometric patterns and read price action. Neither brain is better than the other, but if you try to force yourself into a style that fights your natural instincts, you will be miserable.
Part 4: Why the Best Traders Usually End Up Using Both
At some point, most veteran traders realize that picking a side is a rookie move. You don't need a six-monitor setup to combine them, either. It can be as simple as checking the economic calendar on Sunday, figuring out which currencies have a strong tailwind, and then waiting patiently for the charts to give you a clean, low-risk entry. It’s all about knowing who is in the driver's seat. A beautiful technical setup might give you a green light, but an inflation report dropping in ten minutes is a large red light.
You don't get a medal for staying blindly loyal to one method. The market only rewards discipline, not ideology.
For most successful Forex traders, the hybrid approach is the only way to survive. Fundamentals point the gun. Technicals place the trade.
Think of it like this:
- Fundamental analysis asks: Which currency do I want to hold, and which one is toxic right now?
- Technical analysis asks: Exactly where should I buy it, where am I wrong, and how much risk am I taking?
That is a million times more useful than arguing on a forum.
A Practical Example of the Hybrid Approach
Let’s say the Bank of England is aggressively fighting inflation and hinting at more rate hikes, while the Bank of Japan is asleep at the wheel and keeping rates at rock bottom. Fundamentally, you want to buy GBP/JPY. You aren't just guessing; you have a strong macroeconomic reason to favor the British Pound over the Yen.
Now, you look at the chart. GBP/JPY has been absolutely ripping for three days straight and is currently slamming into large resistance. Buying right now would be purely emotional. So, you wait. Two days later, the pair pulls back to a logical support level, the selling pressure dries up, and a large bullish engulfing candle prints on the 4-hour chart. Your fundamentals gave you the idea, but your technicals kept you from buying the absolute top and gave you a clean entry.
Now flip it. Let's say you spot a gorgeous technical breakout on EUR/USD. It looks flawless. But, you check the calendar and see the US Federal Reserve is announcing their rate decision in 20 minutes. The chart is telling you to buy, but the context is telling you that you're about to gamble on a coin flip. Knowing the fundamentals might convince you to cut your position size in half, or just sit on your hands and watch.
That’s what real-world trading looks like. It’s not about being a purist; it’s about surviving.
Part 5: Which Style Fits You Best?
There is no award for choosing the method that sounds smarter at dinner parties. The only thing that matters is finding a process that fits your patience level, your brain, and your schedule.
You might be a Fundamental Trader if:
- You enjoy reading about economics, politics, and global finance.
- You prefer holding trades for days or weeks to catch large moves.
- You have zero interest in staring at a 5-minute chart all day.
- You want to build a logical thesis, not just react to blinking lights.
- You need to know why something is happening before you risk your money.
You might be a Technical Trader if:
- You are highly visual and spot patterns effortlessly.
- You thrive on strict, mechanical rules and clear risk parameters.
- You want to day trade or get in and out of the market quickly.
- You think economic news is mostly noise and prefer to trust your own eyes.
- You’d rather react to what the market is doing right now than try to predict the future.
You will probably end up blending both if:
- You want the confidence of trading in the direction of the real economy, but demand precise entry points.
- You are sick of taking trades that look amazing on a chart but get crushed by obvious news events.
- You've already learned the hard way that being right about the economy doesn't mean you'll make money if your timing sucks.
If you fall into that last group, welcome to the club.
Part 6: The Mistakes Beginners Make With Both Methods
Usually, the issue isn't that a new trader picked the wrong style. It's that they're using their chosen style completely wrong.
When it comes to fundamentals, beginners try to turn every news alert into a trade. They see "Retail Sales beat expectations!" and instantly hit buy. It doesn't work like that. Most data releases are just background noise. Professional fundamental trading is about knowing which specific data point the market is obsessed with this week, and ignoring the rest.
On the technical side, beginners look for certainty where it absolutely doesn't exist. They collect indicators like a nervous traveler packing six backup phone chargers. They assume more lines equal more accuracy. Instead, they just end up with conflicting signals and absolute analysis paralysis.
But the biggest mistake both camps make? Ignoring risk management because they fell in love with their own analysis. The macro story makes perfect sense. The chart pattern is textbook. They get cocky, double their position size, drop their stop-loss, and then the market does what it always does—something totally unpredictable.
No amount of analysis will ever remove uncertainty from the market. It only helps you manage it.
Give each type of analysis a decision it can actually inform
A fundamental view can explain why a currency might strengthen over time without identifying a favorable entry today. The expected policy difference may already be priced in, or the market may focus temporarily on another risk. A sound economic argument can therefore coexist with an adverse price move for longer than a leveraged position can tolerate.
A technical signal can define an entry or invalidation point without explaining the economic cause of the move. That can be useful, provided the rule has evidence behind it and costs are included. Naming a pattern does not establish that it predicts the next move, just as naming an economic trend does not establish that the trend is mispriced.
Choose a rule for disagreement. You might require a technical setup only within a specified fundamental scenario, or treat the two approaches as separate strategies. What matters is avoiding a process in which whichever method supports the desired trade is selected after the fact. Record the information that justified the original decision.
Review the contribution of each component. Did the additional economic filter improve results or simply exclude some winners and losers at random? Did the technical entry reduce exposure or create costly turnover? A combined method should earn its complexity through clearer decisions or better evidence, not through the comforting impression that two different vocabularies must be stronger than one.
Use a common horizon
A macroeconomic view over six months and a chart signal over six minutes can both be reasonable without supporting the same trade. Decide which horizon governs the position and how conflicting information will be handled. Otherwise, a short-term loss can be defended with a long-term story that was never part of the entry decision.
The combination works better when the roles are explicit: fundamental analysis may define a scenario, while technical rules determine whether and how to express it. Neither should be used selectively to override the other whenever the position becomes uncomfortable. 1, 2, 3
Conclusion: Stop Treating It Like a War
The Forex market is too big, too fast, and too ruthless to care whether you're on Team Chart or Team Economy. It only rewards you for understanding what data matters, knowing when to place the trade, and aggressively protecting your capital when things go sideways.
Fundamentals give you the narrative and the wind at your back. Technicals give you the scaffolding, the timing, and a safe place to hide your stop-loss. If you rely blindly on just one and ignore the other, you are trading with one eye closed. When you blend them, they cover each other's weaknesses beautifully.
So next time you open your terminal, don't ask yourself which method is "right." Ask yourself: What decision am I trying to make right now?
If you're trying to figure out if the US Dollar will dominate this quarter, look at the fundamentals. If you're trying to figure out if you should buy right this second, look at the chart. And if you're trying to not blow your account, ignore both of them and look at your position sizing.
Profitable trading is way less glamorous than YouTube makes it look. It isn't about discovering a secret indicator or predicting the global economy. It’s about building a reliable routine that keeps you grounded when the market is quiet, keeps you safe when it goes crazy, and keeps your own ego from blowing up your account.
This is why the pros eventually stop asking, "Which side is better?" and just start asking, "What gives me an edge today?"
That mental shift changes everything. Whichever tool you use to enter a trade, just make sure you grade yourself honestly. If you bought based on a macro theme, did that theme play out? If you bought based on a chart, was your entry clean? Keep them separate in your head so you don't end up making excuses and twisting the narrative after a losing trade. Stay honest, stay disciplined, and let the market do the rest.
Sources and further reading
- Bank of England: Money Creation in the Modern Economy
- CFTC: Eight things to know before trading forex
- BIS: April 2025 FX turnover, September 2025 preliminary release
Editorial revision: 7 October 2026. Numerical scenarios are hypothetical unless identified as historical. References support the added explanations and selected corrections; rules and product terms should be checked again before acting.