
Stock screeners narrow a large universe using criteria such as valuation, growth, profitability, or debt. They are useful for organizing research, but their output depends on definitions, reporting periods, and data quality. A company passing every filter has not yet become a sound investment. The next step is to understand why its numbers look attractive and whether the comparison is meaningful.
Why Investors Need Filters in the First Place
Imagine trying to buy a house without using any filters on a real estate app. No price limit, no preferred neighborhood, no bedroom count. No way to exclude properties that clearly don't fit your life. You’d waste weeks looking at mansions you can't afford and tiny condos hours away from your job.
Nobody shops for a home that way, yet people dive into the stock market like that every day. They catch a ticker on TV, read a random comment online, or buy a stock just because a buddy swore it was "about to pop."
That’s not a strategy. That’s just reacting.
A stock screener flips the script. Instead of asking, "What stock is everyone talking about today?" you get to ask a much better question: "Which companies fit the exact type of investment I'm looking for?"
Maybe you want highly profitable businesses with zero debt. Maybe you're hunting for reliable dividend payers with a long track record of stability. Or maybe you want aggressive, small companies growing their revenue at lightspeed. The point isn't that one strategy is best; it's that a screener forces you to define what you want before the market noise distracts you.
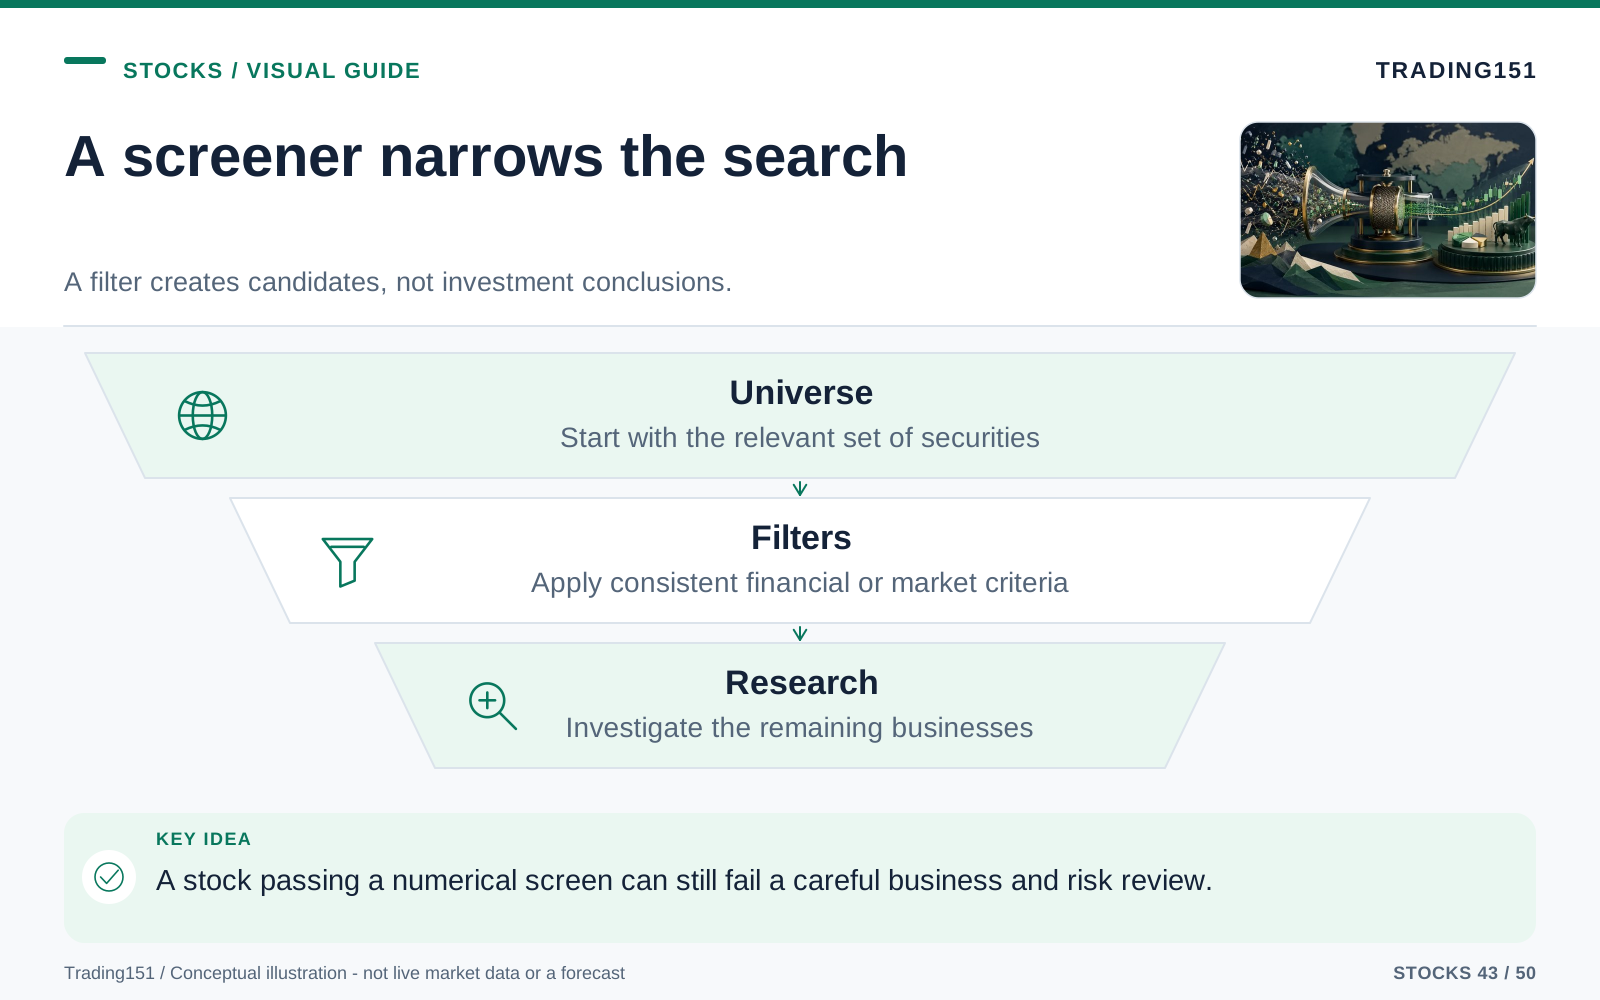
Read this diagram as text
- Universe
- Start with the relevant set of securities
- Filters
- Apply consistent financial or market criteria
- Research
- Investigate the remaining businesses
What a Stock Screener Does
At its core, a stock screener is just a large, searchable database of public companies. It lets you slice, dice, and exclude stocks based on anything from market size and profitability to debt levels, dividend yields, and price performance.
Think of it as a funnel. You pour the entire stock market into the top, set up a few specific roadblocks (your filters), and see what trickles out the bottom. The companies that make it through are your shortlist.
And shortlist candidates is the crucial phrase here. A screener doesn't make the final call for you. It has no idea if a company is facing a large lawsuit, losing its competitive edge, relying on a single shaky supplier, or coasting on a temporary accounting loophole. It just knows the math matched your settings.
Used well, it’s the ultimate starting point. Used lazily, it’s just a highly efficient way to make terrible decisions.
Start with the Investment Style, Not the Tool
It’s tempting to open up a screener and start substantially clicking dropdown menus just because they're there. Don't do that. Before you even touch the tool, figure out what kind of investor you want to be. Define your core idea in plain English first. "I want profitable companies with low debt and steady growth" is an actual thesis. "P/E under 15" is just a setting. Once you have a clear idea, you can test different filters and see what falls through the cracks.
An investor a few years away from retirement shouldn't be running the same screens as a 25-year-old trying to aggressively grow a small, speculative account. Someone looking to hold stocks for a decade cares about entirely different metrics than someone day-trading momentum swings.
Here are a few ways people usually approach it:
- Value investing: Hunting for businesses that seem unfairly beaten down or cheap compared to their actual earnings, cash flow, or long-term worth.
- Growth investing: Looking for companies expanding their sales, user base, or market share way faster than average.
- Dividend investing: Seeking out established companies that regularly cut cash checks to their shareholders.
- Quality investing: Focusing on durable, fortress-like businesses with wide profit margins, low debt, and consistent track records.
- Momentum investing: Finding stocks that are already on a hot streak and riding the wave relative to the broader market.
You don't have to pledge allegiance to just one camp. The best investors often mix and match. But you need to know what you’re hunting for, or the screener just turns into a slot machine with extra columns.
Essential Stock Screener Filters in Plain English
Open any decent screener and you’ll see more metrics than you could ever realistically use. Some are helpful, some are super niche, and some are straight-up dangerous if you don't know the context. Let’s break down the foundational filters that answer the big questions.
1. Market Capitalization
What it measures: The company’s total price tag on the open market (calculated by multiplying the share price by the total number of shares).
Plain-English meaning: How large is this business?
Large-cap companies are the heavyweights. They usually have deep pockets, diverse customer bases, and fewer existential threats. They aren't immune to failure, but they won't blow away in a light breeze either.
Small-caps and micro-caps, on the other hand, can grow fast because they have so much room to expand. But they can also crash and burn just as quickly. A single failed product or lost client can take them down.
Market cap doesn’t tell you if a stock is good or bad, it just tells you its weight class. A $2 billion company and a $200 billion tech giant play by completely different rules.
2. Price-to-Earnings Ratio
What it measures: How much you’re paying for every dollar of profit the company makes.
Plain-English meaning: Is this stock a bargain, or is it priced for perfection?
If a stock has a P/E of 15, you’re essentially paying $15 for every $1 of its annual earnings. A low P/E might mean the stock is on sale, or it might mean Wall Street expects the company to implode. A high P/E usually means investors expect large growth, but it also means the company has zero room to mess up.
Just remember to only compare P/Es within the same industry. Comparing the P/E of a slow-moving utility company to a hyper-growth software startup is completely useless. Their business models and growth speeds are entirely different animals.
3. Forward P/E
What it measures: The stock price compared to what analysts expect the company will earn in the future.
Plain-English meaning: What’s the price tag based on what Wall Street thinks is going to happen next?
The market is always looking ahead, which makes Forward P/E really useful. The catch? It relies entirely on human predictions, and analysts get it wrong all the time. If they're wearing rose-colored glasses, a stock might look a lot cheaper than it really is.
Treat it as a helpful hint, not absolute truth.
4. Revenue Growth
What it measures: How fast the company's sales are climbing.
Plain-English meaning: Are they selling more stuff?
You can fake earnings for a while by slashing costs or tweaking accounting rules, but long-term growth always requires selling more products or services.
Just keep an eye out for businesses growing sales while losing large amounts of money on every transaction. That might fly for a young tech startup building market share, but it's not a dynamic you can ignore forever.
5. Profit Margin
What it measures: The chunk of revenue that ends up as profit.
Plain-English meaning: After paying for everything, how much cash is left in the register?
High margins give a company a lot of breathing room. They can easily absorb a jump in supply costs, invest heavily in new tech, or aggressively pay down debt. Thin-margin businesses (like grocery chains or airlines) can still be great investments, but they have to operate flawlessly because there is almost no room for error.
Always judge margins based on the industry standard.
6. Debt-to-Equity Ratio
What it measures: How much borrowed money the company relies on compared to shareholder money.
Plain-English meaning: Is this company living within its means, or is it drowning in loans?
Debt isn't a bad word. Smart companies use it to fuel expansion all the time. It only becomes a nightmare when the economy slows down or interest rates shoot up, making those loans expensive to pay back.
If you find a stock that looks suspiciously cheap, check the debt immediately. The market isn't always being stupid; sometimes it's just terrified of a toxic balance sheet.
7. Free Cash Flow
What it measures: The actual cash left over after the business pays for its day-to-day operations and necessary upgrades (like new equipment). Different screeners calculate this slightly differently, so always double-check the actual cash flow statement to make sure a sudden jump isn't just a weird timing trick.
Plain-English meaning: How much cold, hard cash is piling up in the bank account?
Accounting earnings can be legally manipulated with non-cash charges and fancy math. Cash is much harder to fake. A company throwing off plenty of free cash flow is in control of its own destiny. They can use that cash to buy competitors, reward shareholders, or bulletproof their balance sheet.
8. Dividend Yield
What it measures: The annual cash payout shown as a percentage of the current stock price.
Plain-English meaning: How much passive income does this stock generate right now?
If a stock costs $100 and pays $4 a year, that’s a 4% yield. It’s a favorite metric for income investors wanting regular checks.
But be wary of a yield that looks way too high. A 12% yield looks tempting, but remember that yield goes up when the stock price crashes. A sky-high yield usually means Wall Street knows a dividend cut is coming, and they’re abandoning ship.
9. Payout Ratio
What it measures: The percentage of total earnings the company is using to pay its dividend.
Plain-English meaning: Can they afford to keep writing these checks?
If a company makes $100 million and pays out $40 million in dividends (a 40% payout ratio), they have a nice, comfortable cushion. If they’re paying out 95% of their earnings, they are walking a tightrope. A single bad quarter could force them to slash the dividend.
If you care about income, always look at yield and payout ratio as a pair.
10. Beta
What it measures: How substantially the stock swings up and down compared to the overall stock market.
Plain-English meaning: How seasick will this stock make you?
A beta of 1.0 means the stock generally moves in lockstep with the market. Higher than 1.0 means it’s a rollercoaster; lower means it’s relatively calm.
Beta is strictly backward-looking, so it’s not flawless. But it really helps you gut-check your risk tolerance. Buying a hyper-volatile stock sounds great on paper until you panic-sell it at the bottom of a 20% drop.
11. Return on Equity
What it measures: How effectively management is using shareholders' money to generate profits.
Plain-English meaning: Is leadership good at growing our money?
A consistently high ROE is a hallmark of a fantastic business. Just be careful—companies can artificially inflate their ROE by taking on a mountain of debt or buying back a lot of stock.
When you see a sky-high ROE, ask yourself why. If it’s because they have a killer competitive advantage, that's exciting. If it's because they're heavily leveraged, step back.
Useful Screening Ideas for Different Investors
There is no universal, formula. The right screen depends entirely on what you want to own. But it helps to see how vague goals translate into actual screener settings.
A Basic Quality Screen
- Market cap over $5 billion (avoids tiny, fragile companies)
- Positive earnings
- Positive free cash flow
- Reasonable debt-to-equity ratio
- Return on equity above the industry norm
- Stable or rising revenue growth
This isn't for finding the absolute cheapest stock in the world. It’s for finding strong businesses that aren't playing reckless financial games.
A Dividend Stability Screen
- Dividend yield above the market average, but not suspiciously high
- Payout ratio low enough to leave a safety net
- Positive free cash flow
- A track record of maintaining or raising dividends
- Moderate to low debt
Perfect for folks who want reliable income and hate the idea of chasing dangerous "yield traps."
A Growth Screen
- Revenue growth significantly above average
- Earnings growing (or showing rapidly improving profitability)
- Expanding profit margins
- Manageable debt load
- Showing some price strength compared to peers
Growth screens find exciting companies, but you have to stay disciplined. Overpaying for a fantastic company is still a bad investment.
A Value Screen
- P/E ratio lower than its industry peers
- Price-to-book or price-to-sales looking cheaper than competitors
- Still generating positive cash flow and earnings
- Debt levels that won't crush the company
- Sales aren't falling off a cliff
Value investing is lucrative, but it's full of booby traps. A cheap stock can stay cheap for a decade if the business is rotting from the inside. Always ask yourself why it's on the clearance rack.
The Biggest Mistake: Treating the Screener as the Answer
A screener is great at telling you a company is growing fast, paying a fat dividend, or trading at a discount. What it can’t tell you is if the company is losing relevance, if the management team is trustworthy, if those numbers are inflated by a one-time event, or if the entire industry is entering a large slump.
That’s why hitting "search" on a screener is merely step one.
When a stock passes your filters, it has earned a few minutes of your time. It hasn't earned a dime of your capital. Before you hit "buy," you have to do the quiet, unglamorous work of real research.
Research Tools: Where the Real Work Begins
Research tools let you peel back the curtain. They help you read what management is saying, comb through the real financials, size up the competition, and spot the risks that a basic algorithm completely missed.
Great investors don't just ask if a stock is cheap. They ask, "How does this business make money, why is it priced like this, and what needs to happen for me to turn a profit?"
1. Company Filings
Annual reports (10-Ks) and quarterly reports (10-Qs) are the raw, unfiltered truth. They aren't exactly beach reading, but they are absolutely essential. Slide decks and investor presentations are marketing materials designed to make the company look great. The SEC filings are legally binding documents where they have to tell you the bad news.
Pay special attention to the "Risk Factors" section. It's written in dense legalese, but it will tell you exactly what keeps the CEO awake at night.
When you dig into a filing, just look for the answers to these basic questions:
- How do they get paid?
- Are sales growing organically, or are they just buying up other companies?
- Are their profit margins getting wider or getting squeezed?
- How ugly is the debt situation?
- What specific threats does management keep bringing up?
- Does the actual cash in the bank match the shiny earnings numbers?
2. Financial Statement Tools
Trying to read a raw spreadsheet can make your eyes bleed. Thankfully, research platforms format income statements, balance sheets, and cash flows into clean, easy-to-read tables so you can instantly spot trends.
Never just look at the last twelve months. Zoom out. A single great quarter could just be luck. Five years of steadily rising cash flow and shrinking debt? That’s a trend.
Keep an eye out for weird contradictions. If profits are supposedly rising rapidly but free cash flow is consistently weak, find out why. If sales are up but debt is growing twice as fast, understand the trade-off.
3. Earnings Call Transcripts
Earnings calls are pure gold because you get to see how executives handle unscripted, direct questions from skeptical Wall Street analysts. You learn so much just from their tone.
Confident management teams answer hard questions directly and explain exactly how they plan to fix their missteps. Weak teams hide behind vague corporate buzzwords, dodge the specifics, and blame the "macroeconomic environment" for everything.
Read a few consecutive transcripts over a year or two, and you'll quickly figure out if leadership keeps its promises.
4. Analyst Reports and Estimates
Wall Street analysts aren't fortune tellers, and they get things wrong constantly. But reading their reports gives you a baseline for what the rest of the market broadly expects to happen.
If a stock is priced for perfection, but analysts are quietly lowering their estimates for next year, you need to figure out why. Use their reports to borrow their industry expertise, but never let an analyst make your final decision for you.
5. Charting Tools
Hardcore long-term investors sometimes dismiss stock charts as astrology. They shouldn't. A long-term chart gives you the emotional history of a stock. It shows you if a company is in a relentless multi-year uptrend, or if it's been slowly bleeding out for a decade despite having seemingly "great fundamentals."
You don't need to draw twenty geometric lines on a chart to get value out of it. Just glancing at the overall trend and major support levels can save you from impulsively catching a falling knife.
6. News and Event Tracking
Stocks don't exist in a vacuum; they live in the messy real world. Lawsuits, supply chain chaos, CEO scandals, large acquisitions, and changing interest rates can wreck a perfectly good balance sheet.
A solid news feed provides context. If a stock suddenly drops 20% and pops up on your value screen, the news feed will tell you if the market is just having a temporary temper tantrum, or if something catastrophic just happened to the core business.
7. Peer Comparison Tools
Never evaluate a stock in complete isolation. Always stand it up next to its closest rivals to see if it’s a great deal, or just mediocre.
Peer comparison answers the highly practical questions:
- Are they growing faster than their competitors?
- Do they have better profit margins?
- Are they carrying way more debt?
- If the stock is cheaper than its peers, is there a good reason for it?
- Do they have a genuine moat?
Sometimes the absolute best result of researching a company is realizing their biggest competitor is the better buy.
Where Everyday Investors Can Find Good Tools
You don’t need to spend thousands on a professional Bloomberg Terminal to do great research. There are plenty of powerful platforms available to everyday investors.
Good Starting Points
- Yahoo Finance: The old reliable workhorse. Great for checking quick quotes, reading news, running basic screens, and viewing estimates.
- Google Finance: Minimalist and super clean. Perfect for a fast price check or managing a simple watchlist.
- Your own brokerage: Don't overlook this! Fidelity, Schwab, and others have fantastic, free screening, comparison, and research tools built right into your dashboard.
For Deeper Fundamental Research
- Morningstar: Amazing if you care about patient, deep-dive fundamentals—stuff like competitive moats, fair value estimates, and detailed analyst insights.
- Seeking Alpha: A great place to read crowdsourced opinions. It’s useful to read a super-bullish article and a deeply bearish article back-to-back to weigh both arguments.
- SEC EDGAR: It looks like it was built in 1995, but it’s the official government database for corporate filings. It’s where the actual truth lives.
For Visual Market Analysis
- Finviz: Famous for its large, colorful market heat maps, super-fast screening capabilities, and insider trading data.
- TradingView: The absolute gold standard for charting. It has a beautiful interface, limitless tools, and a large community sharing ideas.
For Financial Data and Watchlists
- Koyfin: Think of it as a clean, highly accessible alternative to a professional terminal. Fantastic for deep macro overviews and company comparisons.
- Tikr: A phenomenal tool for digging deep into global stocks, financial statements, and decades of company history.
Don't try to use everything at once. The best setup is usually a lean combination: one good screener, one charting platform, one place for filings, and one news source. Keep it simple.
A Simple Research Workflow You Can Use
Your research process shouldn't feel like writing a master's thesis. If you make it too complicated, you'll just end up with analysis paralysis and avoid making a decision entirely.
Here’s a simple, straightforward workflow you can stick to:
- Step 1: Know what you want. Are you looking for steady income, high growth, or a beaten-down value play? Pick a lane.
- Step 2: Run a broad screen. Set up your filters, but keep them loose enough to give you a decent handful of candidates to look at.
- Step 3: Toss the trash. Quickly weed out companies with concerning debt, sinking sales, unsustainable dividends, or business models you just don't understand.
- Step 4: Understand the business. Read the company summary. How do they earn their cash?
- Step 5: Check the tape. Look at the last several years of financials. Are margins up? Is debt down? Is cash flowing?
- Step 6: Size up the rivals. Compare the stock to its competitors to see if it’s the best in its class.
- Step 7: Catch up on the gossip. Read the latest news and skim the most recent earnings transcript to see what management is worried about.
- Step 8: Write it down. Force yourself to write a three-sentence thesis. Why are you buying it? What’s the worst-case scenario? What exactly would make you sell?
That last step is highly underrated. If you can’t easily explain to a friend why you’re buying a stock, you don't understand it well enough to buy it.
Red Flags a Screener May Not Catch
Algorithms can't read between the lines. A screener won't warn you if a company just lost its patent, its visionary founder quit, an aggressive accounting change was made, or its biggest client walked out the door. You have to find that context yourself. When a stock looks like an absolute steal, look closely for these hidden landmines:
- A dividend yield that defies logic: It's usually flashing a large warning sign that a cut is coming.
- Debt that’s quietly exploding: Growing fast by borrowing aggressively works great right up until credit markets freeze.
- Putting all their eggs in one basket: If one large customer represents half of their revenue, the business is fragile.
- A revolving door in the C-suite: Constant executive turnover is almost always a symptom of a deeper, toxic internal problem.
- Sales are up, but margins are falling: They might be heavily discounting their products just to create the illusion of growth.
- Endless share dilution: If a company keeps printing new shares to fund itself, your slice of the pie is quietly shrinking every year.
- Fake profitability: Check if their latest "great quarter" was just because they sold off a piece of real estate or had a one-time tax benefit, rather than actual business success.
Seeing one of these red flags doesn't mean you automatically walk away. It just means you need to hit the brakes, investigate, and completely understand the risk before committing your capital.
Common Beginner Mistakes
Most screening mistakes happen when people treat individual metrics like cheat codes. A low P/E doesn't guarantee a stock is cheap. A high dividend doesn't guarantee you'll get paid. Blistering sales growth doesn't mean the company is a great business, and strong past performance means absolutely nothing for tomorrow.
Another classic mistake is piling on way too many filters. If your screen is so unusually strict that it only spits out two stocks, you haven't uncovered the two best companies in the world. You've just built a highly specific trap to confirm your own biases.
On the flip side, avoid filters so loose that they hand you 400 results. The entire goal is to get a manageable list of names you can realistically dig into.
And finally, do not keep tweaking your filters until they finally show the stock you already decided you wanted to buy. That’s not research; that’s just playing pretend with a spreadsheet.
The Human Part of Investing
Software can organize spreadsheets beautifully, but it can't give you emotional intelligence. A screener has no idea what your financial goals are, how much cash you need to sleep at night, or if you'll panic and sell everything the next time the market takes a dive.
A tool might show you a hyper-growth tech stock with flawless financials. But if you know that 30% price swings will make you sick to your stomach, that stock doesn't belong in your portfolio—no matter how promising the business is.
Successful investing isn't just about picking winners. It’s about building a portfolio that matches your personality so you can hold onto it through the deeply uncomfortable periods.
The Golden Rule: Do Not Let the Tool Make the Decision
Screeners are brilliant at sorting data. They are absolutely terrible at understanding context.
They can find you a low P/E ratio, but they don't know the company's entire industry is being replaced by new technology. They can highlight a fat dividend, but they can't promise the payout will survive the winter. They can identify rapidly growing revenue, but they can't tell you if that growth is sustainable.
That responsibility rests entirely on your shoulders.
Use screeners to discover the possibilities. Use research tools to investigate the scene. But rely on your own judgment, patience, and risk management before you ever hit the buy button.
A screener returns candidates, not conclusions
Check the definition of each field before combining it with another. A data service may use trailing earnings for one ratio and estimates for another, or calculate debt and cash flow differently from a competing service. A screen that appears precise can therefore mix measurements that do not belong together.
Investigate extreme results first. A very low valuation ratio may reflect a one-off gain, peak cyclical profit, a stale share count, or an impending business problem. A high dividend yield can arise because the price has fallen in anticipation of a cut. The unusual number is a research question, not a conclusion that the market overlooked something obvious.
Adapt the criteria to the business model. Banks, insurers, property companies, and industrial manufacturers use capital differently, so a filter designed for one group may be misleading for another. Even within a sector, accounting policies and acquisition histories can complicate comparisons. The relevant metric should follow the economics of the business rather than the convenience of a common spreadsheet column.
Save the screen's date, universe, and settings. That record allows you to distinguish changes in the company from changes in the tool or its data. Then read the filings, assess the balance sheet, and test the valuation. A screener is doing its job when it reduces the number of companies requiring attention without pretending to replace that attention.
Verify the result in the filing
A screener narrows a search; it does not complete the research. An unusual ratio can reflect stale data, a one-time item, a different accounting definition, or a recent corporate action. Check the underlying filing and calculation before treating the result as an opportunity. The most useful next step is often to explain why the number looks unusual, not to rank the company immediately as cheap or expensive. 1
Use the Filter to Find Questions, Not Answers
The stock market feels a whole lot less intimidating when you realize you don't need to track everything. You don't need an opinion on every headline, every minor earnings miss, or every random stock movement. You just need a reliable process that filters out the junk and highlights the real opportunities.
Treat the numbers on your screen as a conversation starter, not the final word. Data providers all calculate things slightly differently, and an outdated estimate can make a terrible company look like a screaming buy. If a specific metric is the main reason you're buying a stock, go read the primary documents and verify it yourself.
The best tools in the world are just there to help you ask sharper questions, and then get out of your way. No algorithm can measure a management team's integrity, brand loyalty, or your own tendency to FOMO into bad trades. Let the software do the heavy lifting, but always take full ownership of the final conclusion.
Sources and further reading
Editorial revision: 7 October 2026. Numerical scenarios are hypothetical unless identified as historical. References support the added explanations and selected corrections; rules and product terms should be checked again before acting.