
The S&P 500, Nasdaq Composite, Nasdaq-100, and Dow Jones Industrial Average describe different parts of the U.S. stock market under different construction rules. They are not interchangeable measures of every investor's experience. Their constituents and weighting methods determine which companies drive the result. Understanding those rules makes a market headline more informative than simply noting whether an index finished higher or lower.
What Exactly Is a Stock Market Index?
Let's hit pause for a second and talk about what an index is. At its core, an index is nothing more than a math problem—a calculation. You can't call up your broker and buy a share of "the index." Instead, you buy an index fund or an ETF (Exchange-Traded Fund). These are the actual products that attempt to mirror the index by scooping up the stocks inside it. Since different funds use slightly different methods to copy the index, they can end up with minor differences in fees, tax impacts, and overall performance.
Picture walking into a large supermarket. If a friend asked, "Are groceries getting more expensive?" you wouldn't grab a clipboard and check the price tag of every apple, box of pasta, and frozen pizza in the store. That would take days.
Instead, you’d probably just look at a standard basket of staples: milk, eggs, bread, and maybe coffee. If that specific basket costs more this month than it did last month, it’s safe to say grocery prices are creeping up. You didn't check every item, but your basket gave you a pretty accurate read on the overall trend.
A stock market index does the same thing, just with companies instead of groceries. It’s a pre-selected basket of stocks meant to represent a chunk of the broader market. When the stocks in the basket go up in value, the index climbs. When they drop, the index takes a hit.
Sounds simple enough, right? But here’s the catch: these baskets are all packed differently. Some only hold a few mega-famous companies, while others cram in thousands of smaller ones. Some indexes give more voting power to stocks with higher price tags, while others care more about the company's total large size. These structural quirks matter a lot because they completely change the story the index is trying to tell.
So, the next time you hear a news anchor confidently announce that "the market is up," your first thought should probably be: which market are we even talking about?
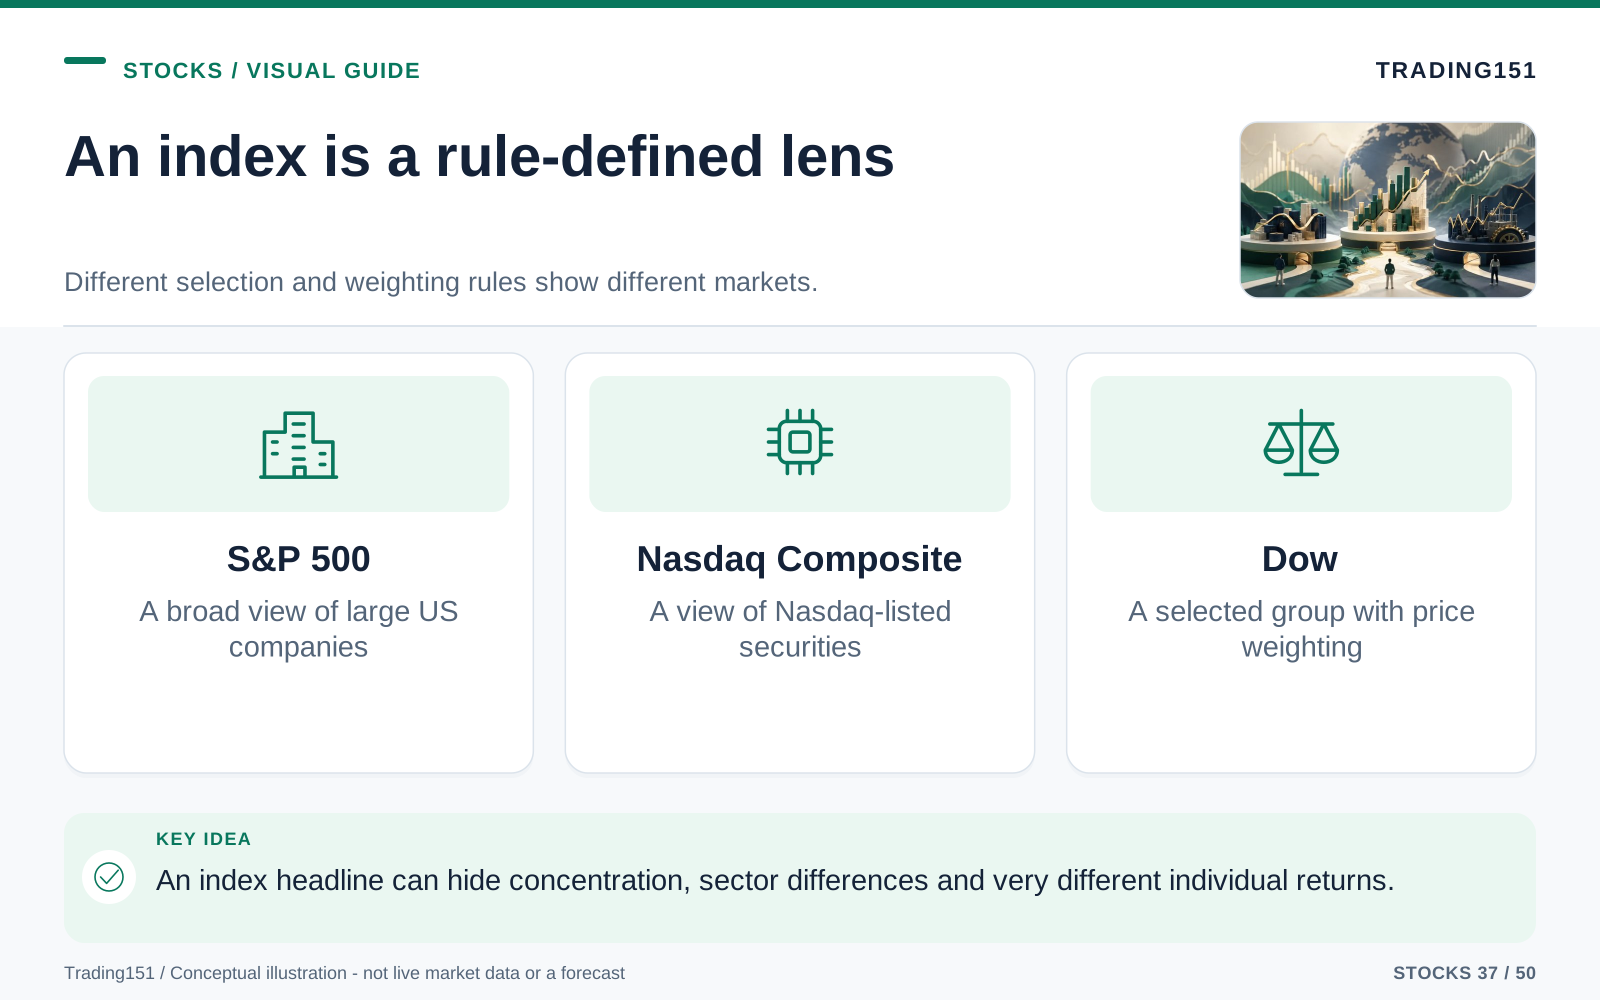
Read this diagram as text
- S&P 500
- A broad view of large US companies
- Nasdaq Composite
- A view of Nasdaq-listed securities
- Dow
- A selected group with price weighting
1. The Dow Jones Industrial Average: The Old-School Headliner
The Dow Jones Industrial Average—or just "the Dow"—is the one everyone knows, even if they’ve never bought a stock in their lives. It’s been on the evening news for so many decades that it basically feels like the daily weather forecast. When your neighbor complains that "the market tanked," they’re usually talking about the Dow. Interestingly, it runs on an old-school "price-weighted" system. That means a stock with a high price per share gets more sway, even if the actual company is much smaller in total value. Because of this, a simple stock split can shrink a company's influence in the index overnight, even though the business itself hasn't changed a bit. (They use a special math trick called the "Dow Divisor" to smooth out those weird hiccups so the index doesn't randomly crash when a split happens.)
The Vibe: The classic, seasoned headliner. It’s famous and nostalgic, even if the pros know it’s no longer the best way to take the market's temperature.
The History: Back in 1896, a journalist named Charles Dow (who also helped start The Wall Street Journal) dreamed this up. America was a heavily industrial country back then, so his original list was packed with companies moving coal, sugar, cotton, and tobacco—the real heavy lifters of the late 19th century.
What’s in the Basket Today? Fast forward to today, and the Dow holds just 30 large American companies. We’re talking about "blue-chip" giants—brands so deeply woven into daily life that you definitely know them, whether you invest or not. Today's list features tech titans, large retailers, and healthcare conglomerates. The word "Industrial" in the name is basically just a vintage souvenir at this point.
The Quirk: As mentioned, it's price-weighted. The higher the price of a single share, the louder that company's voice is in the index.
This creates some pretty weird situations. A company trading at $400 a share can drag the Dow up or down dramatically, even if a company trading at $40 a share is technically worth ten times as much in the real world. It’s sort of like deciding how big a house is by looking at the numbers painted on its mailbox rather than measuring the actual square footage.
The Dow remains a widely followed measure, but its small membership and price weighting make it different from a broad capitalization-weighted index. Whether it is a useful benchmark depends on the portfolio or question being assessed, not on its age alone.
It might not be the most accurate thermometer in the medicine cabinet, but it’s the one our grandparents used, so we keep reaching for it.
2. The S&P 500: The Market’s Main Scoreboard
The S&P 500 is a large-cap U.S. equity benchmark weighted by float-adjusted market capitalization. A company's weight reflects the value of its shares available to public investors, subject to the methodology. A standard S&P 500 fund therefore does not allocate equally across its constituent companies. Equal-weight versions follow a different weighting and rebalancing approach.
The role: A broad measure of large-cap U.S. shares, not a complete measure of all U.S. businesses or the global stock market.
The History: Created by Standard & Poor’s to fix the Dow's blind spots, the S&P 500 was designed to cast a much wider net. Instead of looking at a tiny elite club of 30, it tracks about 500 heavy hitters across practically every industry.
What’s in the Basket Today? It holds the biggest players on the U.S. stock exchanges. Tech giants take up a huge chunk of space, sure, but they share the basket with banks, oil producers, pharmacy chains, real estate trusts, car makers, and food brands. Because it covers so much ground, it’s the closest thing we have to an actual scoreboard for Corporate America.
Market capitalization is the market value of a company's outstanding equity. For index weighting, the S&P 500 adjusts for the publicly available share float. Neither measure should be confused with enterprise value, which also considers debt and cash, or with the amount of money investors originally contributed.
Under this system, large companies get a much bigger slice of the pie than smaller ones. And that makes sense. If one of the most powerful tech or healthcare corporations on Earth suddenly has a terrible day, it should send bigger shockwaves through the market than a mid-sized regional business.
But there is a catch. Because the heavyweights are so large, a tiny handful of mega-corporations can end up bullying the rest of the index. When tech giants are having a banner year, they can drag the entire S&P 500 up with them. If they stumble, they pull the whole thing down. It’s a large basket, but it's very top-heavy.
The S&P 500 is a common benchmark for large-cap U.S. equity portfolios. It is not automatically appropriate for a global portfolio, a small-cap strategy, or a portfolio holding substantial bonds and cash. A fair comparison should match the assets and risks being managed.
An index fund offers a way to hold exposure to the benchmark without selecting each company individually. That can reduce research demands and concentration in a single business, but it does not eliminate equity-market risk or guarantee a suitable allocation for every goal.
3. The NASDAQ Composite: The Growth Engine With a Temper
The Nasdaq Composite is an entirely different animal. It’s younger, heavily stacked with tech, and notoriously moody. Whenever the world gets obsessed with the next big thing—like artificial intelligence, cloud software, electric cars, or biotechnology—the Nasdaq completely steals the spotlight.
The Vibe: Ambitious, fast, and occasionally totally exhausting. It feels like a genius on its good days and an absolute nightmare on its bad ones.
The History: Launched in 1971, the Nasdaq was the world's first electronic stock market. Back when traditional exchanges were still crowded with shouting financial professionals, the Nasdaq felt like the future. Naturally, it attracted a lot of young, scrappy tech startups—many of which grew into the digital behemoths that run our lives today.
What’s in the Basket Today? The Composite tracks thousands of companies that trade on the Nasdaq exchange. It technically holds a bit of everything, but tech and high-growth companies completely dominate its DNA. It’s the home of microchips, streaming platforms, online shopping empires, and biotech labs.
The Nasdaq Composite and Nasdaq-100 are different indexes. The Composite covers eligible Nasdaq-listed securities under its methodology, rather than every instrument listed on the exchange. The Nasdaq-100 focuses on 100 of the largest non-financial companies listed there. They can share major holdings without being interchangeable benchmarks.
The Rollercoaster: Because it’s packed with companies banking on large future growth, the Nasdaq is sensitive to the overall mood of investors. When money is cheap and people are substantially optimistic about the future, the Nasdaq rises sharply. But the second interest rates creep up, or people start worrying that tech stocks are overpriced, it can drop like a rock.
That wild volatility isn't really a bug; it's a feature. Growth companies are often valued not on the money they make today, but on the large profits people hope they'll make in ten years. When those hopes are high, prices rise sharply. When reality sets in, the corrections can leave a mark.
It’s a thrilling ride for patient investors, but it requires nerves of steel. It’s easy to love the Nasdaq when everything is going up. It’s a lot harder to stay calm when it takes a dive and the evening news starts tossing around words like "bursting bubble" and "panic."
Why the Three Indices Sometimes Move Together
More often than not, the Dow, the S&P 500, and the Nasdaq all head in the same general direction. One might jump 2% while another only creeps up 0.5%, but they’re generally reacting to the same macro forces.
Interest rates are the classic example. If Wall Street thinks borrowing money is about to get cheaper, stocks usually rally across the board. If rates look like they are staying high, stocks struggle because investors can just put their cash into safer things like bonds and still get a decent return.
Inflation does the same thing. When prices surge, companies pay more for supplies, and ordinary people tighten their belts. The Federal Reserve usually steps in to cool things down, which acts like a wet blanket on the entire stock market—even for the companies that are handling it well.
Then you have the real wildcard stuff: unexpected recessions, geopolitical conflicts, tangled supply chains, or large energy spikes. When major global events happen, the tiny differences between these three indexes stop mattering. Fear (or greed) takes over, and investors either rush into the market all at once, or run for the exits together.
Why They Sometimes Disagree
But then there are those weird days where the Big Three are totally out of sync. You’ll see the Dow up in the green while the Nasdaq is bleeding red. It doesn't mean the data is broken—it just proves how different these baskets really are.
Let's say investors suddenly decide that tech stocks are way overpriced. They start dumping shares of software and semiconductor companies. The Nasdaq will naturally take a large hit, and it’ll drag the S&P 500 down with it, since tech is such a big slice of that pie.
Investors may shift between sectors as expectations change, and differences in composition and weighting can produce divergent index returns. The Dow is not a pure defensive-stock portfolio, however. Its response depends on its actual constituents rather than a general assumption that it owns only stable businesses.
The opposite happens all the time, too. If everyone loses their minds over a new AI breakthrough, the Nasdaq will rocket upward while the Dow just sits there looking bored. The market isn't just one giant organism acting in unison; it's a lot more like a big city, where different neighborhoods become trendy or quiet down depending on the season.
Points, Percentages, and Why Headlines Can Mislead
News sites love talking about "points" because they sound so dramatic. A headline screaming "Dow Plunges 500 Points!" gets clicks because it feels concerning. But without context, points are basically meaningless. Percentages are the only way to understand what's happening.
A 500-point fall from 10,000 is 5%; the same 500-point fall from 40,000 is 1.25%. The point change is identical, but the percentage change is not. Neither figure alone explains the cause of the move or whether it is appropriate to change a portfolio.
You see this in your own bank account. A $1,000 loss sounds awful out of context. But if you have $500,000 invested, it’s a tiny fluctuation. If you only have $5,000 invested, it’s a devastating blow. The context changes everything.
This is why financial media can make completely normal market shifts feel like the end of the world. They are fighting for your attention. A glowing red chart and a giant scary number look way better on TV than an anchor calmly explaining that the market dipped by a totally normal fraction of a percent.
I'm not saying we should ignore market drops entirely—just that we should keep them in perspective.
From Watching to Participating: How People Invest in These Indices
It’s cool to understand how all this math works, but you probably just want to know: how do I use this to make money?
You can't buy an index directly. As we talked about earlier, it's just a measurement. You can't go to a broker and buy a "share of the Dow."
Instead, you buy an index fund or an ETF (Exchange-Traded Fund). These are giant pools of money that just buy the stocks inside the index you're targeting. When the index goes up, your fund goes up right alongside it, minus a few tiny fees.
An S&P 500 fund provides exposure to its benchmark through the fund's holdings and implementation approach. The investor owns fund shares rather than directly owning every underlying company. The index includes 500 companies but can contain more than 500 securities when multiple eligible share classes are included. Diversification reduces some company-specific risk, not the possibility of a broad market loss.
- A Dow ETF gives you a piece of those 30 iconic blue-chip brands.
- An S&P 500 ETF spreads your money out across hundreds of top companies across basically every industry.
- A Nasdaq-100 ETF leans heavily into tech and innovation by tracking the biggest non-financial players on the Nasdaq.
People call this "passive investing." Sure, it sounds a little lazy, but it's an smart play. It's built on a very humbling reality: almost nobody—not even Wall Street pros—can consistently pick winners, avoid losers, and perfectly time the market year after year. So, rather than spending your life trying to find the needle in the haystack, passive investing just buys the whole haystack.
There is a lot of power in that simplicity. You don't have to glue yourself to financial news, stress out over quarterly earnings calls, or chase internet rumors. Most importantly, it keeps you from doing what ruins most investors: panic-selling the second the market gets a little bumpy.
What These Indices Mean for Your Real Life
Here's the thing: even if you never intentionally buy a single stock, the Big Three still rule your financial life. If you have a 401(k), a pension, a college fund for your kids, or any kind of retirement account, there's an excellent chance your money is heavily tied to these indexes.
When the S&P 500 goes on a multi-year winning streak, regular retirement accounts quietly grow. When the Nasdaq takes a beating, anyone holding growth-heavy funds feels the sting. And when the Dow crashes and makes front-page news, it drags down the overall mood of the country, even if your personal investments are doing fine.
They also totally dictate how we talk about the economy. A soaring stock market makes people feel rich and businesses feel bold. A falling market makes everyone tighten their grip on their wallets, even if they haven't lost their jobs or seen any actual changes in their day-to-day lives. The stock market isn't the real economy, but it controls our expectations—and expectations drive how people spend money.
Still, don't read too much into the daily noise. The Dow having a terrible Tuesday doesn't mean the country is collapsing. The Nasdaq hitting an all-time high doesn't mean every tech company is thriving. Markets constantly react to rumors, panic over headlines, and sometimes just get totally swept up in the hype. They are great tools, but they definitely don't know everything.
The Long Game
The best way to look at these indexes isn't as a daily mood ring. Think of them as a long-term map tracking how businesses grow, innovate, and evolve over decades.
In the short run, the market is pure chaos. A grumpy quote from a politician, a minor shipping delay, or a bad quarter for a major brand can send prices spiraling. But zoom out to the long run, and the market is driven by things that matter: real companies making real profits, inventing new products, and growing their footprint.
Now, this doesn't mean the line always goes up. It absolutely doesn't. Recessions, market crashes, weird flat periods, and burst bubbles are just part of the deal. If you're going to put your money into index funds, you have to be ready to grit your teeth through some really uncomfortable stretches. That’s just the price of admission for long-term growth.
The hardest part of all this isn't understanding the math behind the indexes. It's fighting the urge to do something drastic when the numbers turn red. The S&P 500 slipping on a random Thursday is not a sign to sell everything. The Nasdaq crushing it for three weeks straight isn't a sign to dump your life savings into it. Good investing is boring. It should be built around your goals, your timeline, and what you can comfortably afford to risk—not whatever the financial news happens to be reporting on today.
Know which Nasdaq, and know how each index is weighted
The Nasdaq Composite and Nasdaq-100 are particularly easy to confuse. The Composite includes a broad set of eligible Nasdaq-listed securities, while the Nasdaq-100 selects large non-financial companies listed on Nasdaq under its methodology. Neither name simply means every technology company, and a fund tracking one does not provide the same exposure as a fund tracking the other.
Weighting changes the meaning of an index move. The S&P 500 uses float-adjusted market-capitalization weighting, so larger eligible companies generally have greater influence. The Dow is price-weighted, which gives a higher-priced component more influence per share than a lower-priced one, subject to the index divisor and adjustments. A stock split can therefore matter differently to the two methods.
An index also changes over time. Companies enter and leave, share counts change, and corporate actions require adjustments. A historical return for an index reflects the methodology and its evolving membership, not a promise that today's individual constituents will all remain successful. Read the current methodology when a detail affects the comparison.
For investment purposes, distinguish the index from the fund that tracks it. Fees, cash holdings, trading arrangements, and tracking differences can affect the fund's result. Also check whether a quoted index return includes reinvested dividends. Comparing a price-only headline with a total-return fund figure can make two similar exposures appear more different than they really are.
Compare returns on the same basis
An index's price return excludes a different set of cash flows from its total return. A fund's published performance may include reinvested distributions and deduct ongoing expenses, while a headline market quotation may show only the price index. Comparing those figures without checking the basis can produce a misleading conclusion about whether the fund tracked well.
Use the same period, currency, and return convention. Distinguish an index from the investable product that follows it; the fund has costs, implementation choices, and tax consequences that the index calculation may not include. A currency-hedged fund adds another difference that needs to be understood rather than attributed automatically to poor tracking.
The appropriate benchmark is also a matter of exposure. A global portfolio with bonds should not be judged solely against the strongest U.S. equity index of the year. That comparison can make a sensible allocation look deficient simply because it was designed to take different risks. Choose the benchmark before seeing the result, and keep the comparison consistent enough to reveal meaningful deviations instead of rewarding hindsight. 1, 2, 3, 4
Read the Basket Before the Headline
The stock market doesn’t have to feel like an exclusive club where people in expensive suits speak a secret language. Once you wrap your head around what these indexes are, the daily headlines start to make a lot of sense.
The Dow tracks 30 large U.S. companies using price weighting. The S&P 500 uses float-adjusted capitalization weighting across 500 large companies. The Nasdaq Composite covers eligible Nasdaq-listed securities and differs from the more concentrated Nasdaq-100. Knowing those distinctions is more useful than treating all four as interchangeable versions of 'the market.'
When you look at them together, they tell a story that no single index could tell on its own. They show you if people are playing it safe or chasing growth, if tech is dominating or falling behind, and whether the overall mood on Wall Street is hopeful, terrified, or just bored.
So the next time you see a frantic headline about the market, ask yourself two quick questions: what is in this basket, and how is it being weighed? Once you know that, it’s completely obvious why a point drop in the Dow isn't the same as a point drop in the Nasdaq, and why one part of the market can be throwing a large party while another is quietly falling apart.
Indexes are just maps, not the actual territory. They completely ignore private companies, mom-and-pop shops, your salary, and a thousand other vital parts of the real economy. Even within Wall Street itself, an index can look strong just because two or three mega-corporations are thriving, while the average company is barely treading water.
An index summarizes a defined set of securities under a defined set of rules. Check both before using it to judge your portfolio. A familiar name can be a useful reference without being the right benchmark for the assets you hold.
Sources and further reading
- S&P Dow Jones Indices: S&P 500
- Nasdaq: Nasdaq-100 Index Methodology
- S&P Dow Jones Indices: Dow Jones Industrial Average
- Investor.gov: Index Funds
Editorial revision: 7 October 2026. Numerical scenarios are hypothetical unless identified as historical. References support the added explanations and selected corrections; rules and product terms should be checked again before acting.