
Fundamental analysis asks what a business may be worth and what supports that estimate. Technical analysis examines price and trading data to describe market behavior or define trading rules. They can serve different purposes in the same process, but combining them does not automatically create stronger evidence. Each method needs a clear job and an honest test.
What Fundamental Analysis Really Means
Fundamental analysis starts with a very grounding reality check: a stock isn’t just a blinking ticker symbol on your phone. It’s a literal piece of ownership in a living, breathing company. Behind those letters are real products, real employees, debts, competitors, and cash hitting a bank account.
A fundamental investor's goal is to figure out exactly what that business is truly worth—often called its intrinsic value. If the market is pricing the stock lower than that true value, it might be a great time to buy. If the price has soared way past what the company can realistically justify, they’ll walk away, no matter how much hype is driving the stock.
Basically, they’re asking: "Is this a solid business, and is the current price fair?"
This mindset demands patience. Fundamental investors don't usually sweat what the stock does by tomorrow afternoon. They care about where the company will be in five or ten years. They’re hunting for resilient businesses that can grow over time, weather economic storms, and consistently compound their money.
What Fundamental Analysts Look At
When a fundamental investor digs into a company, they put on a business owner's hat. They don't care if the stock's chart looks pretty. They care if they’d want to own the business itself. Good fundamental work goes way past just checking off a few financial ratios. Revenue growth might look amazing until you dig in and realize they’re practically giving the product away just to inflate sales numbers. Profit margins might be up, but only because they fired half their crucial staff. The analyst’s job is to read between the lines of the spreadsheet and see if the company's story holds up.
1. Revenue and earnings: Revenue is the money coming in the door; earnings are what’s left over. A company can bring in billions and still be broke if its costs are out of control. Fundamental investors want to see healthy, sustainable growth, not just growth for the sake of a press release.
2. Profit margins: This shows how much of every sales dollar turns into profit. Two companies might make the same amount in sales, but if one has wider margins, it has a large edge. It has more breathing room to absorb rising costs, survive recessions, or undercut competitors.
3. Debt and cash: Debt isn’t inherently evil. Lots of great companies borrow to fund expansion. But too much debt is a ticking time bomb, especially if interest rates spike or sales suddenly dry up. Looking at the balance sheet tells you if the company has enough of a cash cushion to survive a bad year.
4. Price-to-earnings ratio: The P/E ratio is a quick way to compare a stock’s price to the actual profit it generates per share. It’s essentially how much you’re paying for a single dollar of the company's earnings. A low P/E might mean the stock is on sale—or it might mean the business is dying. A high P/E might mean it's overpriced, or it might just mean investors expect explosive growth.
5. Competitive advantage: The best businesses have something that makes them hard to copy. Warren Buffett famously calls this a "moat." It could be a beloved brand, crucial patents, high switching costs, or an unshakeable network effect. The wider the moat, the harder it is for rivals to storm the castle.
6. Management quality: Numbers are crucial, but humans are the ones steering the ship. Does the CEO communicate honestly when things go wrong? Do they spend the company’s cash wisely? Do they treat shareholders well? A great business can be tanked by terrible leadership, and a mediocre one can shine under brilliant management.
The Fundamental Investor’s Mindset
If you're going to play the fundamentals game, you need a long attention span. It’s not about hopping on the hottest meme stock of the week. It’s about building quiet conviction. When you deeply understand why you own a company, you’re much less likely to panic-sell when the broader market has a meltdown.
But that doesn’t mean they just blindly hold. True fundamental analysis is cautious. It forces you to ask the hard questions: What’s the worst-case scenario? Is this company too reliant on a single product? Are these profits just a temporary fluke? Is the stock priced for absolute perfection, leaving zero room for error?
The best fundamental investors are basically patient skeptics. They demand hard evidence before they hand over their money. But once they do, they get out of the way and give the business the time it needs to perform.
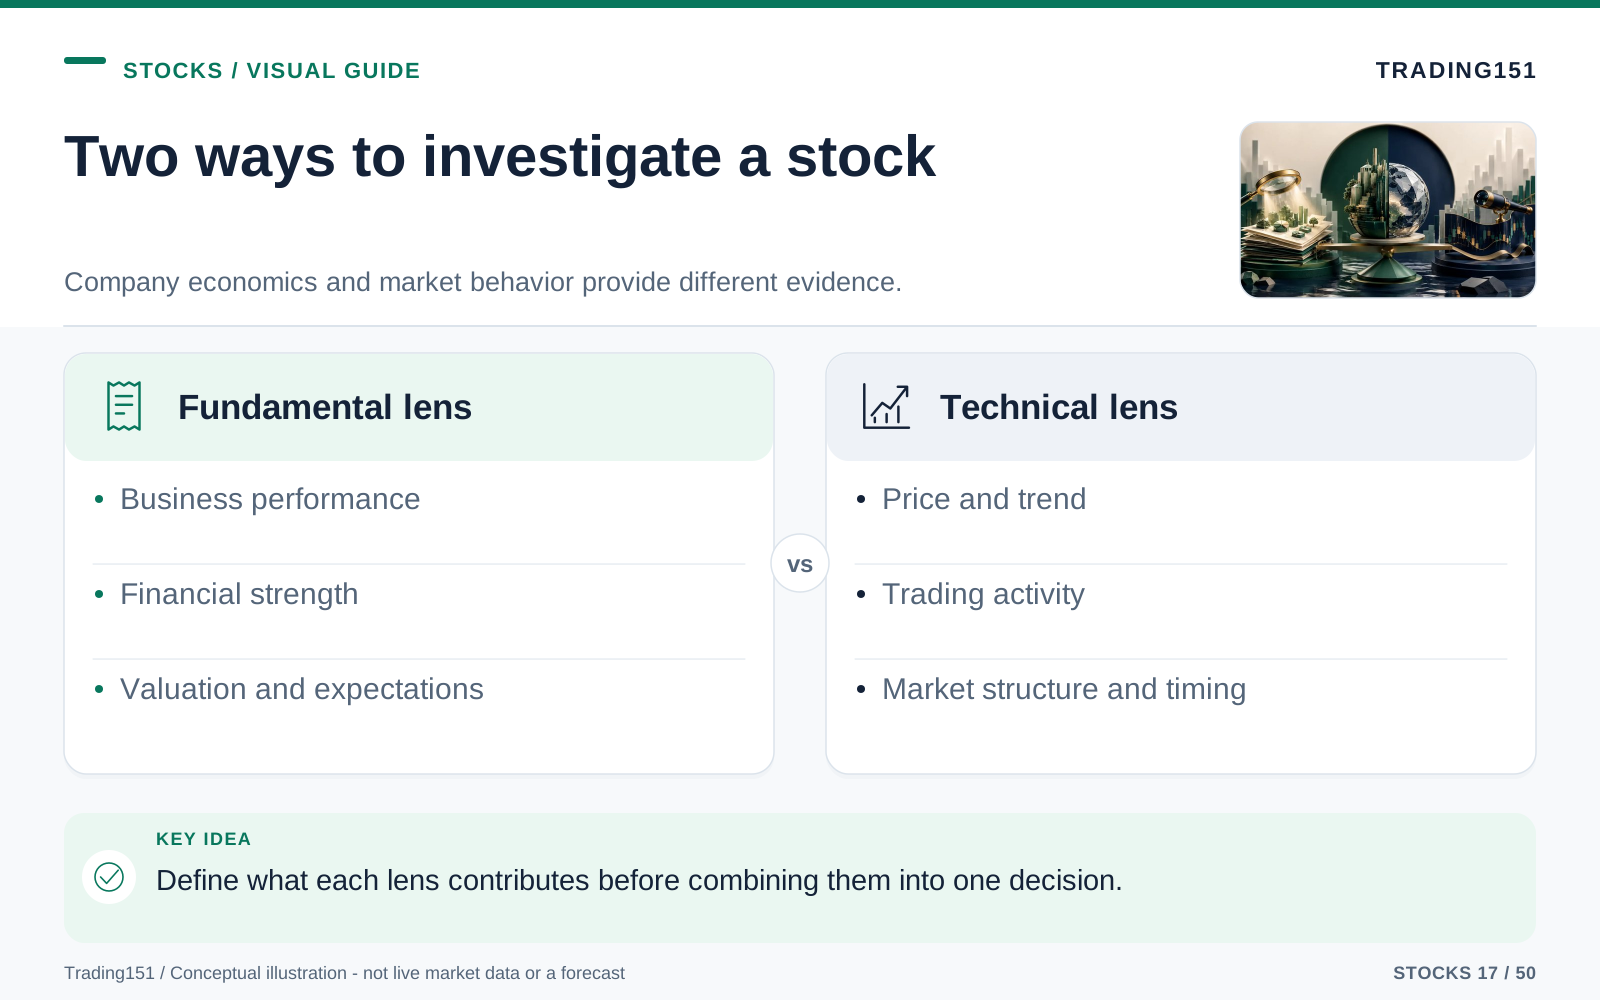
Read this diagram as text
- Fundamental lens
- Business performance; Financial strength; Valuation and expectations
- Technical lens
- Price and trend; Trading activity; Market structure and timing
What Technical Analysis Really Means
Technical analysis flips the script entirely. Instead of stressing over what a company is theoretically worth, it focuses on what the market is physically doing with the stock right now.
For a technical analyst, price movement is the ultimate truth. Every trade is a permanent record of a buyer and a seller making a decision. To them, a chart isn’t random noise—it’s a psychological map of fear, greed, hesitation, and crowd momentum.
A pure technical trader might never read an earnings report or care about profit margins. It’s not necessarily that they think the business doesn't matter. It’s that they believe all that fundamental information is already baked into the stock price. If a company has a genius CEO or a hidden debt crisis, the market is already reacting to it. The chart simply reveals that reaction in real time.
In short, technical analysis asks: "What is the crowd doing, and is this the right time to join them?"
What Technical Analysts Look At
Technical traders rely on charts and indicators to spot recognizable patterns. Some use setups so simple you could draw them on a napkin; others run complex algorithmic models. But almost all of it comes back to a few core concepts. The key is that charts aren't crystal balls predicting the future—they are tools for defining risk. A support line just shows where buyers previously stepped in, and volume shows if there’s real muscle behind a price move. And because patterns fail all the time, a smart trader always has an exit strategy ready.
1. Price movement: Price is the ultimate judge. Is the stock trending up, down, or just chopping sideways? Is it consistently hitting higher highs, or bleeding into lower lows? Traders just want to know who is in control: the buyers or the sellers.
2. Volume: Volume tells you how many shares are changing hands. If a stock jumps up in price but volume is dead, it might just be a fluke. But if a stock breaks past a key price level on large volume, that tells traders the big money is likely stepping in.
3. Trends: There’s an old trading cliché: "The trend is your friend." Stocks in motion tend to stay in motion. An upward trend naturally attracts more buyers via FOMO, while a downward trend feeds on panic. Traders generally prefer to surf the wave rather than paddle against it.
4. Moving averages: Day-to-day stock prices are jagged and chaotic. Moving averages smooth out that noise to reveal the bigger picture. A 50-day moving average, for example, plots the average price over the last 50 days. If a stock is cruising above it, things look healthy. If it crashes below it, traders start getting nervous.
5. Support and resistance: Support is basically a floor—a price level where buyers have historically jumped in to catch a falling stock. Resistance is a ceiling—a level where sellers tend to cash out, pushing the price back down. These aren't invisible force fields, but they matter purely because so many market participants are watching them.
6. Chart patterns: Technical analysts look for familiar shapes in a stock's chart. Terms like "head and shoulders," "cup and handle," or "bull flag" might sound silly to an outsider. But they’re really just visual shorthand for human psychology shifting between supply and demand. They aren't guarantees—they're clues.
The Technical Trader’s Mindset
Technical analysis naturally appeals to people who care deeply about timing, managing risk, and reading crowd behavior. A technical trader absolutely hates the idea of being "theoretically right" about a company while actively losing money on the stock. If a trade turns against them, they want to cut their losses immediately and move on.
This sharply practical mindset is vital because the market doesn’t always reward a good fundamental story right away. A company can have pristine financials and still watch its stock bleed out for a year. Conversely, a terrible company on the brink of bankruptcy can see its stock violently rally just because short sellers are panicking.
Because of this, technical traders rarely fall in love with the companies they trade. They might buy a stock on Tuesday, hold it for three days, and dump it on Friday without ever knowing what the company sells. It’s a purely transactional relationship. If the setup works, they ride it. If the chart breaks, they leave.
A Simple Coffee Shop Example
Let’s step away from the stock market for a second and imagine a local neighborhood café called Joe’s Brew.
The fundamental analyst visits Joe’s Brew: They walk in, buy a black coffee, sit in the corner, and start sizing the place up like an owner. They estimate how many customers walk through the door. They wonder what Joe is paying for espresso beans, rent, and wages. Are sales growing? Is there an empty lot next door where a huge chain could pop up and ruin Joe's business? After crunching the numbers, they realize Joe has locked in a great lease, has loyal regulars, and pulls in a fantastic profit margin. It’s not flashy, but it's steady. They decide they’d love to buy a piece of the business and hold it for the next decade.
The technical analyst watches Joe’s Brew: They don't even go inside. They stand across the street and just watch the foot traffic. They notice the morning line has been spilling out the door lately. They see that whenever the nearby office building hosts a conference, Joe’s gets slammed. They also notice the place is practically a ghost town after 2 p.m. They don't care about Joe's accounting books. They just see a clear, visible pattern of increasing demand.
The technical analyst might buy a stake today because the momentum is red-hot. But the moment that morning line starts shrinking, they are selling their shares and walking away.
Both people are looking at the same coffee shop. One is zeroing in on the intrinsic value of the business. The other is reading the real-time behavior of the customers. Neither is inherently foolish—they’re just playing different games with different evidence.
Where Fundamental Analysis Can Go Wrong
Fundamental analysis sounds logical, but it has its own pitfalls. The biggest trap is the illusion of precision. An analyst can build a complex financial model that spits out a stock's "true value" down to the exact penny. But that model relies entirely on wild guesses about what inflation, consumer habits, and interest rates will look like five years from now. Smart investors know to use rough ranges instead of pretending their spreadsheet is undeniable fact.
Then there’s the infamous "value trap." A stock might look like an incredible bargain because its P/E ratio is historically low or it just crashed 40%. But sometimes, a stock is cheap because the business is actively dying. A cheap stock is only a good deal if the company has a future.
Timing is another severe reality check. You can be 100% right about a company’s long-term potential, but if you buy too early, you might have to sit through months or years of painful losses before the rest of the market catches on. Being right about the value doesn't guarantee the price will move in your favor anytime soon.
And finally, there's the danger of overconfidence. A gorgeous, highly detailed deep-dive into a company doesn't make it immune to a recession. A model is only as good as the assumptions you type into it.
Where Technical Analysis Can Go Wrong
Chart-reading isn't a flawless cheat code, either. It comes with plenty of baggage.
The most frustrating part? False signals. The market is noisy. A stock might look like it’s breaking out to new highs, tricking traders into buying, only to aggressively plummet the very next day. A perfectly drawn chart pattern can be instantly destroyed by a single bad earnings report, a weak broader market, or a sudden change in mood.
Technical analysis is also dangerous because it constantly tempts you to do something. Because charts are updating every second, there is always a new pattern forming. This tricks people into overtrading. Jumping in and out of stocks constantly racks up fees, triggers emotional decision-making, and drastically increases the odds of making a mistake.
Then there’s the psychological trap of seeing things that aren't there. Humans are hardwired to find shapes, even in total chaos. If a trader stares at a messy, random stock chart long enough, they will eventually convince themselves it's saying exactly what they secretly want to hear.
Real technical analysis isn’t about drawing magic lines and hoping for the best. It requires ruthless discipline, strict rules for managing risk, and the humility to admit when a trade is dead wrong.
Do You Have to Choose One Side?
No. You don't have to pledge allegiance to one camp. In fact, some of the most thoughtful investors actively blend the two.
It doesn’t have to be complicated. You can screen for companies with strong balance sheets and great products to build your watchlist. Then, you can look at the charts to make sure you aren't buying in on the exact day the stock is in a large freefall. The chart shouldn't replace your belief in the business, and a great business case doesn't give you an excuse to buy recklessly.
The most practical way to merge them is simple: let fundamentals tell you what to buy, and let technicals tell you when to buy it.
Fundamentals can help you decide what to buy: Look for companies with cash in the bank, growing profits, a real edge over their competitors, and a bright future. This keeps you from throwing money at garbage companies just because their chart looks exciting on social media for a few days.
Technicals can help you decide when to buy: Once you’ve found a great company, check the chart to optimize your entry. Instead of buying blindly, you might wait for a recent sell-off to stabilize, or for the stock to break out of a long, boring sideways trend.
For the everyday investor, this one-two punch is powerful. Fundamentals give you the confidence to hold the stock. Technicals give you a much smarter entry and exit plan.
Will this eliminate all risk? Of course not. Great companies stumble, and perfect chart setups fail all the time. But viewing the market through both lenses keeps you from wearing blinders.
Investor vs. Trader: The Time Horizon Matters
A huge reason fundamental and technical folks argue so much is because they are entirely talking past each other. They operate on completely different timelines.
If you’re building a portfolio for your retirement 20 years from now, the day-to-day squiggles on a stock chart mean absolutely nothing. What matters is whether the company can grow its earnings, beat its rivals, and survive the next economic downturn.
But if you’re swing-trading a stock over a couple of weeks, the company's 10-year strategy is irrelevant. You aren't sticking around long enough to see it play out. In that world, price momentum, trading volume, and exactly where you place your stop-loss matter far more than a deep dive into the balance sheet.
Neither timeline is morally superior. You just have to know which game you are actively playing. Disaster strikes when you mix them up—like when someone claims they are a "long-term investor" but panics and sells because the stock dropped 3% on a Tuesday. Or when a short-term trader accidentally becomes a "long-term investor" because a trade went bad and they refused to cut their losses.
Finding the Approach That Fits You
Ultimately, the best method isn't just about financial theory. It’s heavily dependent on your own personality.
If you're the kind of person who loves diving into business models, reading up on industry trends, and thinking in years rather than hours, fundamental analysis will feel right at home. You probably have the stomach to wait out a slow-moving thesis.
But if you love visual patterns, crave immediate feedback, and are obsessed with managing risk mathematically, technical analysis will probably click for you. You're likely comfortable making rapid decisions as long as you have a clear plan.
Knowing yourself is half the battle. Some people simply cannot handle the anxiety of active trading. Others don't have the patience to sit on a flat stock for three years waiting for the market to realize its underlying value. Being honest about your own temperament matters more than most beginners think.
The stock market is remarkably good at exposing exactly what kind of emotional baggage you carry. Greed makes you chase the top. Fear makes you sell at the bottom. Ego makes you hold onto a losing trade just to avoid admitting you were wrong. Whichever method you lean on, its main job is to protect you from your own worst habits.
Do not let one method excuse a failure in the other
Suppose you buy a company because you believe its cash generation is undervalued. If earnings quality deteriorates, a promising chart pattern does not repair the original business thesis. You may choose to trade the price movement, but that is a new decision with a different rationale. Calling it the same investment can hide a change you have not properly evaluated.
The reverse happens too. A trader enters because of a short-term price setup, then holds a losing position after the setup fails because the company is "good for the long term." That substitutes a valuation claim for a trading rule without doing the valuation work. The familiar name makes the change sound reasonable, but it still increases the commitment beyond the original plan.
Write down which question each tool answers. Fundamental research might determine whether a company belongs on a watchlist; a price rule might govern execution or position review. Specify which evidence invalidates the decision and which observations are merely background. This prevents convenient switching whenever one method produces an unwelcome answer.
There is no requirement to use both approaches. A long-term investor may have little use for a short-term indicator, while a narrowly defined trading strategy may not rely on detailed company valuation. Clarity about the purpose of a tool is more valuable than collecting enough tools to justify any trade after the fact.
Let each kind of evidence answer its own question
A chart can help describe where trading occurred and how volatile the price has been. It cannot establish the quality of a company's receivables or whether its debt can be refinanced. Financial statements can help answer those business questions without identifying the best intraday entry.
Combining the approaches is useful only when their roles are clear. An investor might use business analysis to decide what is worth owning and price information to manage the timing or size of a purchase. The danger comes when one is used to excuse a failure in the other: a weak business is defended because its chart looks attractive, or a broken trading rule is relabeled a long-term investment. State the purpose of the position before choosing the evidence that will govern it. 1, 2
Use the Tool That Fits the Question
We need to stop treating fundamental and technical analysis like opposing religions. They’re really just two different windows looking into the same house.
Fundamentals analyze the business: Is it making money, is it run well, and is the price fair? Technicals analyze the stock: Who is currently winning the tug-of-war between buyers and sellers, and is the timing right to jump in?
They represent completely different layers of the market reality. A company can be fundamentally flawless while its stock gets hammered for six months. Conversely, a dying company can see its stock skyrocket simply because of heavy trading momentum and hype.
The trick is to use the right tool for the specific question you're asking. If you're parking money away for a decade, don't let a minor dip on a daily chart scare you out of a great business. If you're trading for a quick two-hour flip, don't let a promising five-year strategy convince you to hold a violently crashing stock.
Good analysis should result in a concrete plan. You should know exactly why you bought a stock, how much of your money should be in it, what needs to happen to prove you right, and what will trigger you to sell. Whether you pull that data from a dense financial report, a colorful candlestick chart, or a mix of both—the goal is exactly the same. Your strategy should quiet the noise, manage your risk, and make your decisions clear.
Sources and further reading
Editorial revision: 7 October 2026. Numerical scenarios are hypothetical unless identified as historical. References support the added explanations and selected corrections; rules and product terms should be checked again before acting.