
Financial statements describe a business from different angles: profit over a period, assets and obligations at a point in time, and movements of cash. Reading them together is more useful than treating each as a separate set of ratios. The links reveal whether reported growth is collecting cash, requiring more financing, or relying on accounting assumptions that deserve closer attention.
The Three Pillars of Financial Health
Every public company tells its story through three main documents. Each one answers a very specific question, and you shouldn't look at any of them in a vacuum.
- The Income Statement: How much did the company sell, spend, and keep as profit?
- The Balance Sheet: What does the business own, what does it owe, and what's left over for the shareholders?
- The Cash Flow Statement: How much hard cash went in and out the door?
Imagine these as three different camera angles trained on the same company. The income statement is a highlight reel covering a specific stretch of time. The balance sheet is a freeze-frame of the company’s financial health on one specific day. The cash flow statement just follows the money to see if those "profits" are turning into cold, hard cash.
If you only check one of these, you're flying blind. A business can report record profits while totally failing to collect the cash it's owed. It can boast about rising rapidly sales while secretly taking out dangerous amounts of debt to fund them. Or, it might look unprofitable this year simply because it invested heavily in a large future project. To get the truth, you have to read them together and see how they connect.
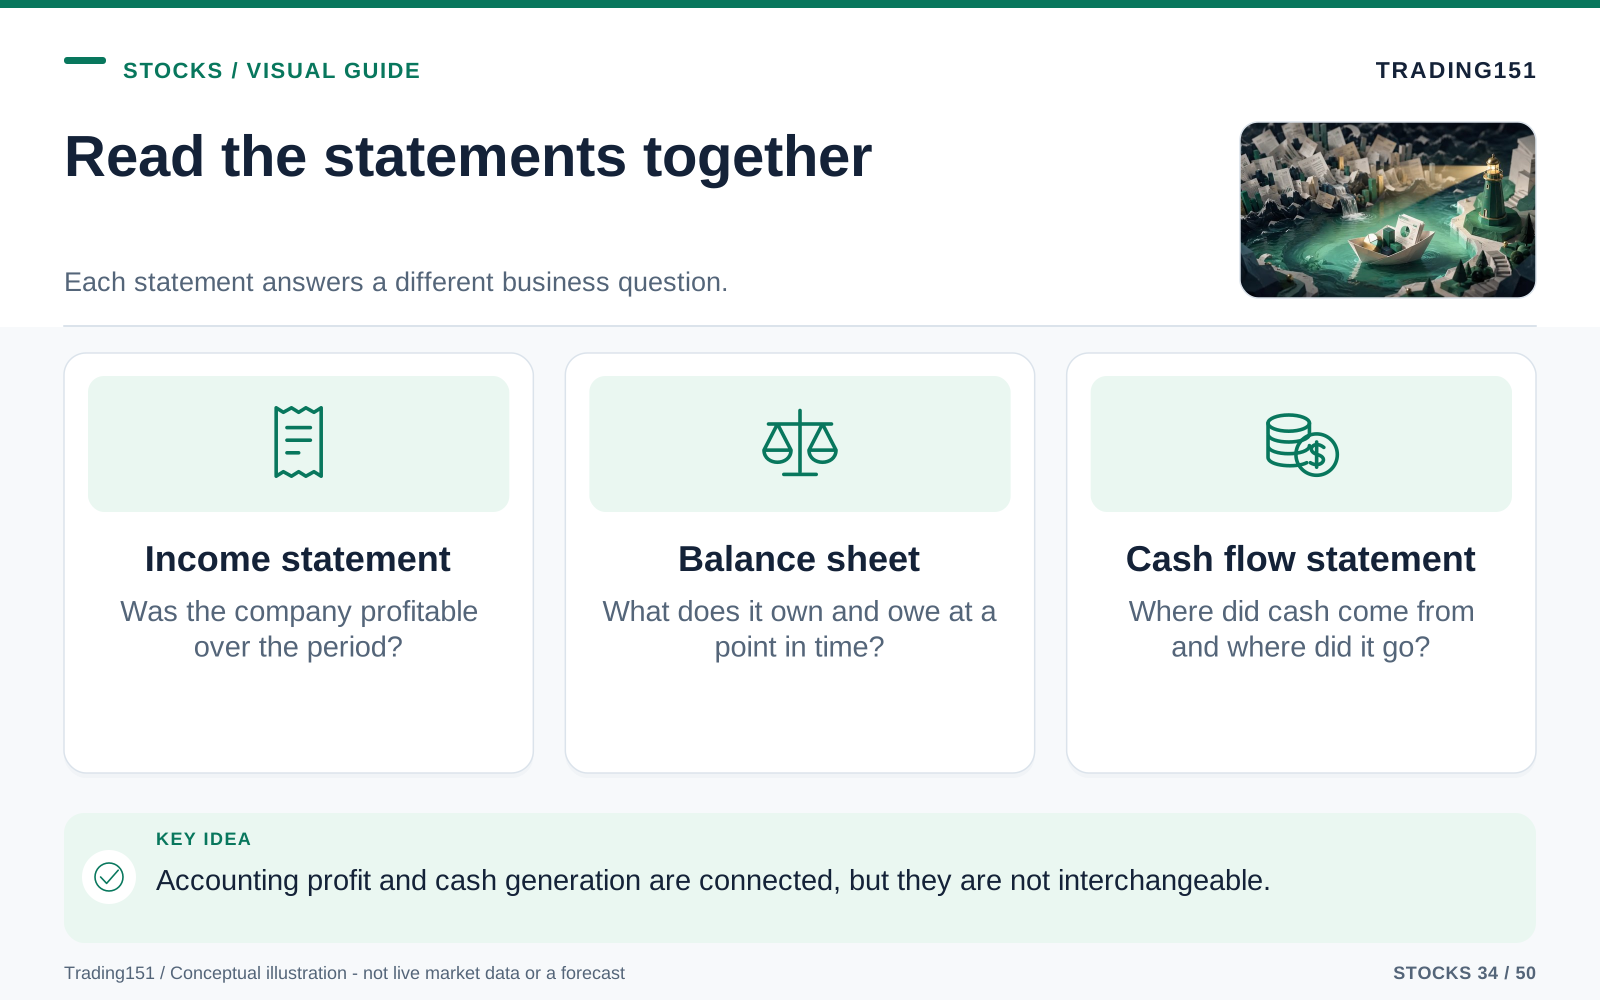
Read this diagram as text
- Income statement
- Was the company profitable over the period?
- Balance sheet
- What does it own and owe at a point in time?
- Cash flow statement
- Where did cash come from and where did it go?
1. The Income Statement: The “How Much Did We Make?” Report
Investors usually sprint to the income statement first because it’s where you find the juicy stuff: sales and profits. It looks at a specific window of time—like a quarter or a full year—and shows how the company got from total sales at the very top down to profit (or loss) at the very bottom.
Think of it like this: the company takes all the money customers handed over. Then, it subtracts what it cost to make the product. Then it takes out the everyday costs of keeping the lights on. Finally, it subtracts things like interest and taxes. Whatever is left in the bucket is the net income.
The Top Line: Revenue
Right at the top, you’ve got Revenue (a lot of people just call it sales). This is the total cash the business earned from its products or services during that time frame. But here's the catch: the quality of that revenue is just as important as how fast it's growing. Are customers coming back month after month on a subscription, or was this just a one-off project? Does the company rely completely on one giant client? You also want to know how they grew. Did they sell more stuff, jack up their prices, buy out a competitor, or just tweak how they report their math? Some of those are great; others are red flags.
If a local bakery sells 10,000 loaves of bread at $5 a pop, their revenue is $50,000. For a software company, it’s all their monthly subscriptions. For an airline, it’s tickets and those annoying baggage fees. The industries change, but the concept doesn't: revenue is the raw money coming in before anyone gets paid.
People call it the "top line" because it’s at the top of the page. You obviously want to see this number going up over time. Growth means people want what the company is selling, they're winning over new customers, they have the power to raise prices, or they're expanding.
But beware: sales growth isn't always a victory. A company can easily boost sales by slashing prices to the bone, blowing a fortune on ads, or overpaying to buy another company. That’s exactly why you can't just look at the top line and call it a day. You have to find out if they can turn those sales into profit.
The Cost of Doing Business: COGS and Gross Profit
It takes money to make money. That bakery has to buy flour, yeast, and ovens, and pay its bakers. A clothing brand has to pay for fabric, factory time, and shipping. A tech hardware company has to buy microchips and pay for assembly.
All these direct costs are lumped together as Cost of Goods Sold (COGS). If it’s a software or service business, they might call it something slightly different, but it means the same thing: the money spent directly to deliver the product.
When you take Revenue and subtract COGS, you’re left with Gross Profit. This is a great number to check because it shows what's left over after paying for the bare-bones cost of making the product.
Gross profit gives you a peek into the company’s underlying economics. A business with a large gross profit is making things for way less than people are willing to pay for them. That gives them a lot of breathing room to pay for marketing, research, and expansion, while still tossing some cash to the shareholders.
The percentage version of this is Gross Margin. If a company brings in $100 million and spends $60 million on COGS, their gross profit is $40 million, giving them a 40% gross margin. Keep in mind that margins change drastically depending on the industry. Supermarkets operate on razor-thin margins, while software companies often have incredible margins because copying a line of code is practically free. The trick is to compare a company against its own track record and its direct rivals, not against the entire stock market.
Operating Expenses
Even after gross profit, the bills keep coming. The company has to pay the sales team, HR, lawyers, rent, insurance, marketing, and the IT department. All of these overhead costs fall under Operating Expenses.
Don't get the wrong idea—operating expenses aren't the enemy. A tech company that stops spending on research is going to get crushed by competitors. A brand that stops marketing will be forgotten. The real question is whether all this spending is moving the needle.
When you subtract those operating expenses from the gross profit, you get Operating Income (or operating profit). Pay attention to this number. It tells you if the company's core, day-to-day business model works before the tax authorities and the banks take their cut.
A business might boast large revenue, but if their office rent, executive perks, and marketing swallow all the profit, you as an investor aren't getting anything. Conversely, if a company is growing its sales but keeping a tight leash on its operating expenses, its profits will skyrocket.
Interest, Taxes, and the Bottom Line
Further down the page, you’ll run into interest payments, interest income, taxes, and sometimes weird, one-off events. Interest expense is a big one to watch because it shows how much debt is dragging the company down. A business carrying too much debt might be handing most of its operating profit over to the bank, leaving shareholders with crumbs.
Once you strip all that away, you finally hit Net Income—the legendary bottom line. This is the final profit after every bill, tax, and accounting quirk has been settled.
Net income is hugely important, but take it with a grain of salt. One giant, unexpected tax break can make a terrible year look fantastic. A large, one-time fee to shut down a factory can make a pretty good year look disastrous. Smart investors never just stare at the final number; they look at exactly how the company got there.
Earnings Per Share: Profit Divided Among Owners
If you're buying stock, net income is usually chopped up into Earnings Per Share (EPS). This just takes the total profit and divides it by the number of shares out there. It makes it easy to see exactly how much profit your specific slice of the pie is generating.
Let’s say a company makes $100 million and has 50 million shares floating around. Your EPS is $2.00. If they make more money next year and the share count doesn't change, the EPS goes up. But if they suddenly issue a bunch of new shares to raise cash, your EPS might drop because you're now splitting that same profit with way more people.
That’s why you always need to keep an eye on the share count. A company can boast about record profits while simultaneously watering down your ownership by issuing new stock. On the flip side, if a company is buying back its own stock responsibly, they are reducing the number of slices in the pie, which boosts your EPS. Just remember: buybacks are great when they’re done with spare cash at a fair price. They are terrible when the company borrows money to do it just to make their weak profits look better.
2. The Balance Sheet: The “What Do We Own and Owe?” Snapshot
If the income statement is a movie of the past year, the balance sheet is a photograph taken on a specific day—usually the last day of the quarter. It tells you exactly where the company stands right at that second.
It all revolves around one strong equation:
Assets = Liabilities + Shareholders’ Equity
It sounds like accounting jargon, but it’s simple. Everything a company owns (assets) was paid for either with borrowed money (liabilities) or the owners' own money (equity).
Think about buying a house for $300,000. You put down $60,000 of your own cash and borrow $240,000 from the bank. The house is your asset. The mortgage is your liability. Your $60,000 down payment is your equity. If the house goes up in value and you pay down the mortgage, your equity grows. If the house’s value tanks, or the mortgage payments become too much, your finances are in trouble.
A company’s balance sheet does the same thing, just with a few more zeroes and categories.
Assets: What the Company Owns
Assets are simply things the company owns or controls that have value. They’re broken down into two buckets: things they’ll use soon, and things they’ll keep for a long time.
- Current Assets are things they plan to turn into cash or use up within a year. Think actual cash in the bank, short-term investments, stuff sitting in the warehouse (inventory), and money customers currently owe them (accounts receivable).
- Non-Current Assets are the heavy hitters they plan to hold onto for years. We're talking factories, delivery trucks, patents, heavy machinery, software, and "goodwill" from buying other companies.
Cash is great because it’s totally straightforward. Accounts receivable, though? That’s worth a second look. It’s the money customers owe but haven't paid yet. If this number is rising rapidly way faster than sales, it might mean the company is letting people delay payment too long, or they are counting sales before they really should.
Inventory is another sneaky one. If a company's inventory is climbing, it could mean they are stocking up for a large holiday rush—which is great. Or, it could mean nobody is buying their stuff and it’s just collecting dust in a warehouse. For retail and manufacturing, inventory levels are a large clue about how business is really going.
The long-term assets just need some common sense. A car manufacturer desperately needs factories. A tech startup might just need some patents and servers. And that "goodwill" line? That usually pops up when they acquire another business. It can become a complication if they eventually admit they overpaid. You don't need to be an expert on every asset, you just need to ask yourself: does this stuff help them make money?
Liabilities: What the Company Owes
Liabilities are just the company's IOUs. Just like assets, they’re split by when they are due.
- Current Liabilities are bills that need to be paid in the next 12 months. This includes money owed to suppliers (accounts payable), short-term loans, taxes, and the portion of their long-term debt that's due right now.
- Long-Term Liabilities are debts they don't have to worry about for over a year, like 10-year bonds, large bank loans, long office leases, and employee pension funds.
Let’s clear something up: debt is not inherently evil. Used correctly, it lets a company build new factories and grow way faster than it could if it only used the cash in its checking account. It only becomes dangerous when the debt gets too heavy for the company's cash flow to support.
A company buried in debt has zero wiggle room. If the economy slows down, interest rates spike, or banks stop being friendly, a business can go from "a little tight" to bankrupt shockingly fast. This is why the balance sheet is your best friend during a recession. Cash-rich companies can scoop up cheap assets and expand while their debt-heavy rivals are busy fighting for their lives.
Shareholders’ Equity: The Owners’ Claim
Shareholders’ Equity is simply what’s left over if the company sold every asset and paid off every debt. On paper, it’s what belongs to the owners (the shareholders).
But here is where you need some context. A tech company might have valuable software engineers and code that barely even show up on the balance sheet, making their equity look tiny. Meanwhile, a traditional bank’s balance sheet is extremely literal. Things like stock buybacks at high prices or past business losses can also make this number look funky. So if equity is low or even negative, don't immediately panic—just treat it as a reason to poke around.
Equity includes things like common stock, retained earnings (profits they decided to keep in the business), and a few other accounting buckets. Don't stress over memorizing every line. Just look at the big trend: is the equity generally positive and growing? Is the company holding onto its profits to build real value, or is that equity bleeding out because of large debts and constant losses?
Some amazing businesses look weird on paper because they don't need a lot of physical assets to run, or they buy back a lot of stock. But as a rule of thumb for beginners: if you see the equity shrinking while the debt is climbing, you need to ask some hard questions.
A Simple Balance Sheet Check: Can the Company Pay Its Near-Term Bills?
Want a fast trick to see if a company is safe? Compare its current assets to its current liabilities. If they have $1 million in cash and short-term assets, but only owe $500,000 over the next year, they can easily cover their bills. They can sleep well at night. But if they only have $1 million in assets and owe $2 million over the next year, they are going to have to scramble to borrow more money, sell off parts of the business, or pray for a miracle.
Finance nerds call this the "current ratio." If it’s over 1.0, they have more assets than near-term debts, which is a good baseline for safety. If it’s under 1.0, it’s not an automatic death sentence (some companies have super predictable cash flows that let them run lean), but it definitely means you need to look closer.
The balance sheet is the graveyard of bad investments. A company can look like a superstar on the income statement, but if they owe a fortune, have zero cash, and are relying on a bank to bail them out, they are walking on thin ice.
3. The Cash Flow Statement: The “Show Me the Money” Tracker
The cash flow statement is where the accounting fluff gets stripped away and reality sets in. It answers the most blunt question in business: did the cash hit the bank account, or is it just an accounting illusion?
This is crucial because companies use something called "accrual accounting." This means they can record a sale the moment they sign a contract, long before the customer pays. It's a useful system for tracking business activity, but it can make a company look substantially profitable even when they are totally broke.
Imagine a consulting agency finishes a big project in December and invoices the client for $100,000. On the income statement, they "made" $100,000 in December. But if the client doesn't cut the check until February, the agency can't use that money to pay their staff in January. On paper, they are rich. In reality, their bank account is empty.
The cash flow statement clears away that fog. It is broken into three simple sections: operating, investing, and financing.
Cash from Operating Activities
Cash from Operating Activities shows you exactly how much cash the core day-to-day business generated (or burned through). For most companies, this is the single most important number on the page.
A solid business should absolutely be generating positive cash from its operations over time. Sure, a young, aggressive startup might bleed cash for a few years as it tries to conquer the market, but even then, you need to know exactly when they plan to stop relying on investors and start supporting themselves.
If you see a mature company bragging about steady net income, but their operating cash flow is consistently weak or negative, hit the brakes. Something is wrong. Maybe customers are ghosting their invoices. Maybe they have warehouses full of unsold junk. Or maybe their "profits" rely on clever accounting tricks instead of real sales. The cash flow statement won't give you all the answers, but it points a giant neon sign at where you need to investigate.
Cash from Investing Activities
Cash from Investing Activities tracks the money spent on long-term assets or the cash made from selling them. This includes buying up new real estate, upgrading servers, buying delivery trucks, or taking over a rival company.
You'll notice this number is usually negative, and that’s perfectly fine! A growing business should be spending cash to build new stores, upgrade software, or build factories. That spending paves the way for tomorrow’s profits.
The real question is whether they aren't just burning money for fun. If a business spends a fortune on "investing activities" year after year, but their sales and cash flow never actually improve, it’s a large red flag that management has no idea how to spend money wisely. Spending cash is the easiest thing in the world. Getting a great return on it is where the magic happens.
Cash from Financing Activities
Cash from Financing Activities tracks the money moving between the company and its backers (the banks and the shareholders). It covers taking out loans, paying off debt, selling new shares, buying back old shares, and paying out dividends.
If they take out a large bank loan, cash comes in. If they pay off a bond, cash goes out. If they issue a million new shares, cash comes in (but your piece of the company just got smaller). If they pay you a dividend, cash goes out.
This section is a lie detector for how the company survives. A business that constantly has to take out new loans or issue new shares just to keep the lights on isn't nearly as successful as its slick marketing suggests. But a company that pays dividends, buys back stock, and pays down debt using the cash it made from running the business? That is a financial powerhouse.
The Ideal: Free Cash Flow
If there is a magic number for investors, it’s Free Cash Flow (FCF). Simply put, this is the cash left over after the business has paid for all its day-to-day operations and bought whatever equipment it needs to stay competitive. It’s exactly what it sounds like: cash that is truly free to be used however management wants.
A lot of companies will try to present their own "adjusted" version of this number to make themselves look better, sometimes ignoring the large amounts of stock they give their executives. So, it's always best to check the math yourself.
The easiest way to calculate it is:
Free Cash Flow = Cash from Operating Activities - Capital Expenditures
You can usually find Capital Expenditures (often called CapEx) right at the top of the investing section. It’s the money spent on physical stuff like buildings, servers, and equipment.
Why is free cash flow so legendary? Because it gives a company choices. A business swimming in free cash flow can afford to pay large dividends, buy back its own stock, crush its debt, buy out annoying competitors, or just build up a large war chest of cash. They operate from a position of total strength.
A company with terrible free cash flow is backed into a corner. They constantly have to beg banks for loans, water down your shares, or slash their budgets just to survive. It doesn’t mean they are doomed, but it makes them a much riskier bet.
How the Three Statements Connect
Once you get a feel for what each statement does, the real magic happens when you see how they talk to each other.
The net income from the income statement flows directly into the balance sheet to boost retained earnings. When equipment loses value over time (depreciation), it drags down the profit on the income statement, but since no actual cash left the building, it gets added right back on the cash flow statement. Unsold inventory sits on the balance sheet, but if that pile gets too big, it suffocates the operating cash flow. And when a company takes out a loan, you’ll see the debt on the balance sheet, the interest payments draining the income statement, and the actual borrowed cash popping up in the financing section.
This is why you can't just pick one good metric and start celebrating. A company showing rising sales, rising profits, and rising free cash flow is a beast. A company showing rising sales but doing it by borrowing billions and destroying its cash flow is a disaster waiting to happen.
When you're reading these reports, play detective. Does the cash flow back up what the income statement is claiming? Does the balance sheet prove they can afford their grand expansion plans? Does the whole picture make sense, or are the numbers screaming contradictory things?
A Beginner-Friendly Way to Read an Annual Report
Annual reports are notoriously thick, but you absolutely do not have to read them cover to cover like a novel. The best way to tackle them is to peel back the layers.
Start with the Business Description
Before you even glance at a number, make sure you know what the company does for a living. How do they make a profit? Who buys their stuff? Is their success tied to a booming economy, fluctuating oil prices, interest rates, or government contracts?
If you can't explain the business to a friend in two sentences, the numbers are going to look like gibberish. High inventory might be totally fine for a furniture store, but a death sentence for a tech hardware company selling outdated phones. Building large infrastructure is totally normal for a railroad, but weird for an ad agency. Context is everything.
Read Management’s Discussion
Most reports have a section (usually called MD&A) where the executives sit down and explain the year’s results. This is gold, especially when you compare what they are saying to what the numbers show. They’ll explain why sales spiked, why costs crept up, and what they plan to do next.
But read it with your skeptic hat on. Management obviously wants to look good, so they tend to put a positive spin on everything. Look for executives who are straight shooters. A great leadership team will bluntly tell you when they messed up, rather than hiding their failures behind corporate buzzwords like "macroeconomic headwinds."
Scan Several Years, Not Just One
A single year of data is basically useless. A company might have had an lucky break, suffered a bizarre one-time catastrophe, or ridden a temporary hype wave. You want to see the movie, not a photograph.
Look at the last three to five years. Check the revenue, operating income, debt, share count, and free cash flow. Which way is the wind blowing? Is the company slowly building an empire, slowly bleeding out, or just bouncing around unpredictably?
Read the Footnotes When Something Looks Strange
The footnotes are the fine print where companies hide the bodies. This is where you’ll find out how they count their revenue, when their large debts are due, how much they’re secretly paying executives in stock, and if they are currently being sued into oblivion.
Don't panic—you don't have to read every note. Just use them as a dictionary. If you see that debt mysteriously tripled this year, flip to the debt footnote to see what happened. If profits spiked but cash vanished, check the notes to see if they changed how they account for inventory. The footnotes are there to solve the mysteries you find in the main numbers.
Useful Ratios Without Getting Lost in Math
Financial ratios are handy shortcuts for comparing companies, but they aren't magic spells. A ratio is only helpful if you understand what it’s measuring and put it in the right context.
Profit Margin
Profit Margin tells you how much of every dollar of sales ends up in the company's pocket. If they have a 10% net profit margin, it means for every $1.00 they ring up at the register, they keep 10 cents after all the bills are paid.
High margins are a large flex. They prove the company has a strong brand, runs efficiently, and can charge premium prices. Shrinking margins usually mean they are being squeezed by inflation, heavily discounting their products to keep up with rivals, or just poorly managed.
Return on Equity
Return on Equity (ROE) checks how efficiently the company is using the owners' money to generate profits. A high ROE sounds amazing, but watch your back. A company can artificially pump up their ROE by taking on dangerous amounts of debt (which shrinks the equity part of the math). Always check the balance sheet before clapping for a high ROE.
Debt-to-Equity
Debt-to-Equity is exactly what it sounds like: it compares the company's debt to its shareholders' equity. It’s a quick pulse check on how leveraged they are. Some industries, like utilities or airlines, naturally have high ratios because building power plants and buying planes is expensive. But a high ratio can also mean a company is highly fragile. The real question isn't "Do they have debt?" It's "Can they easily make their payments if the economy crashes tomorrow?"
Price-to-Earnings
Price-to-Earnings (P/E) compares the current price of the stock to the earnings per share. It’s probably the most famous ratio out there. A high P/E usually means investors are so excited about the company's future that they are willing to pay a premium today. A low P/E might mean the stock is a hidden bargain—or it might mean the market knows the company is about to drive off a cliff.
Never buy a stock just because the P/E ratio is low. Even an incredible business can be a terrible investment if you pay a ridiculous price for it. Valuation only makes sense when you weigh it against how good the business is and how much it’s going to grow.
Green Lights: Signs of a Financially Healthy Business
You don't need a magnifying glass for every line item. If you’re just starting out, look for these simple, healthy traits:
- Consistent Revenue Growth: Sales are marching upward year after year, and the company can clearly explain why.
- Stable or Expanding Margins: They aren't just pushing more volume; they are keeping a healthy chunk of the new money as profit.
- Positive Operating Cash Flow: The actual business brings in real, spendable cash, not just paper profits.
- Reliable Free Cash Flow: Even after paying to upgrade their equipment and grow, they still have cash left over.
- Manageable Debt: They aren't drowning in loans, and their interest payments aren't eating up all their profit.
- Smart Capital Allocation: The leadership team knows exactly when to invest in growth, pay dividends, or aggressively pay down debt.
- A Clear Business Model: You can easily explain how they make money to a five-year-old.
Red Flags: Reasons to Slow Down
Seeing a red flag doesn't mean you should run away screaming. Sometimes there is a totally logical explanation. But it does mean you need to pause and ask some tough questions before you click "buy."
- Flat or Falling Revenue: If sales are stalling, people are losing interest in their product or competitors are stealing their lunch.
- Shrinking Margins: If it’s suddenly costing them way more to make the same amount of money, their profits are about to get squeezed.
- Great Profits but Terrible Cash Flow: This happens innocently sometimes, but if it happens every year, they might be cooking the books or completely failing to collect what they're owed.
- Exploding Debt: Loans can fuel a growth spurt, but a mountain of debt makes a company fragile.
- Endless Share Dilution: If they keep printing new shares every quarter, your piece of the company is quietly getting smaller and smaller.
- Constant "One-Time" Costs: If they have a "rare, one-time restructuring fee" every year, it's not a one-time event. It's just a poorly run business.
- Dodgy Management: If the executives talk in circles, use weird corporate jargon, and refuse to give straight answers when numbers look bad, trust your gut and walk away.
A Small Example: Reading the Story Behind the Numbers
Picture two different companies. Both just proudly announced $1 billion in revenue.
Company A is growing sales by 8% a year, their margins are rock solid, their bank account is overflowing with cash, and their debt is tiny. They use their extra cash to build new products and buy back shares.
Company B also made $1 billion, but their sales haven't budged in three years. Their costs are rising, they keep taking out large loans to stay afloat, and they are constantly issuing new shares to pay the bills. The CEO is on TV hyping up the future, but the numbers look grim.
If you just read the headlines, they look like twins. But if you spend five minutes looking under the hood, they are living in different universes. Company A is a fortress. Company B is a house of cards. That is the superpower that financial statements give you.
Common Beginner Mistakes
Everyone messes up when they first start reading these reports. Dodge these classic rookie errors, and you’ll be way ahead of the pack.
Mistake 1: Looking Only at Revenue
Fast growth is seductive, but it means absolutely nothing if they lose money on every sale. Always check what it cost them to get that revenue.
Mistake 2: Ignoring the Balance Sheet
The coolest app in the world can't save a company that owes a billion dollars to impatient banks. Debt and cash reserves dictate a company's survival far more than a trendy product.
Mistake 3: Treating One Year as a Trend
One fantastic year doesn’t make a company legendary, and one awful year doesn’t mean it's dead. Zoom out and look for multi-year trends.
Mistake 4: Forgetting About Share Dilution
If a company doubles its profit but triples its share count, you lost ground. Always check the EPS to make sure the growth is reaching your pocket.
Mistake 5: Believing Every Adjusted Number
Companies love to publish "adjusted" earnings where they conveniently ignore all their biggest expenses. Sometimes this is fair, but often it’s just a magic trick to hide terrible results. Always check their custom numbers against the boring, standard accounting rules.
Where to Find Financial Statements
Want to dig in? Almost every public company has an "Investor Relations" section on their website. Just look for a tab called "Financials," "SEC Filings," or "Quarterly Results." In the US, the big annual report is called a 10-K, and the quarterly update is a 10-Q. Companies in other countries may use different names, but the core statements are usually similar.
Sure, you can just use Yahoo Finance or your broker's app to see a quick summary. But summaries often strip away the context, and the context is usually where the most important clues are hiding. It’s always worth learning how to read the raw filings.
A Practical Checklist Before Buying a Stock
Before you hit the buy button, run the company through this quick checklist. It doesn't have to be a multi-day homework assignment.
- Can I clearly explain how they make their money?
- Have their sales grown over the last few years?
- Are their profits and margins holding steady, or are they shrinking?
- Does their cash flow back up the profits they are claiming?
- Do they consistently generate free cash flow?
- How much debt are they carrying, and can they afford the payments?
- Are they buying back shares, or watering them down?
- Are the executives giving honest, logical reasons for their performance?
- If the economy tanks tomorrow, do they have the cash to survive?
- Is the stock price reasonable for how good the business is?
You're never going to get perfect answers to all of these. Investing always involves a little bit of a leap of faith. But running this checklist forces you to act like a true business owner instead of a gambler.
Follow one sale through all three statements
Imagine a company records a $1,000 sale on credit, with payment due later. Subject to the applicable revenue-recognition rules, the sale can increase revenue before the customer pays. The balance sheet may show a receivable, while operating cash flow reflects that the cash has not yet arrived. Profit and cash differ for a reason; the question is whether that reason is ordinary and sustainable.
Now consider inventory. A business may buy goods before selling them, using cash while building an asset on the balance sheet. Rapid inventory growth can support expected demand, but it can also indicate unsold products or a need for future write-downs. Compare the movement with sales, management's explanation, and earlier periods rather than assuming all working-capital growth is either good or bad.
Financing transactions have their own place. Borrowing can increase cash without increasing operating profit, and repaying debt uses cash without being an ordinary operating expense. Buying equipment can reduce cash immediately while its accounting expense is spread through depreciation. These distinctions help explain why a profitable business can still face a funding problem.
Read the notes when a figure materially affects the investment case. Debt maturities, lease commitments, share-based compensation, segment results, and accounting judgments often require more detail than the headline statements provide. A useful first reading is not an attempt to memorize every line. It is a search for how the company earns, collects, invests, and finances its money, and where those activities fail to fit the story being told.
Follow a simple sale through all three statements
Suppose a fictional company records a $1,000 sale on credit and the related inventory cost is $600. Ignoring tax and other expenses, the income statement shows $400 of gross profit. The customer has not paid yet, so that profit is not the same as cash collected. Receivables rise, inventory falls, and the cash-flow statement must reconcile the difference between accounting profit and cash movement.
When the customer later pays, cash increases and the receivable falls. That collection does not create a second sale. The example is deliberately simple, but it illustrates why the statements should be read together. Growth in profit accompanied by a persistent buildup of receivables deserves a different interpretation from growth supported by timely collections.
The same approach helps with capital spending and financing. Buying equipment can use cash without appearing as a full immediate expense, while borrowing can increase cash without creating operating profit. A healthy cash balance therefore does not, by itself, establish a healthy business. Trace where the money came from, what obligations accompany it, and whether ordinary operations generate enough cash to support the company's needs. The notes explain details that headline totals leave out. 1
Read the Statements as One Story
Buying a stock without glancing at the financials is like buying a used car because you like the paint job, without ever popping the hood, checking the mileage, or asking why the check engine light is flashing. You might get lucky. Or, you might just be buying someone else’s nightmare.
Financial statements aren’t going to give you an adrenaline rush. They don't offer instant gratification. They require a bit of patience, and yes, you'll probably have to Google a few accounting terms at first. That is totally fine. Every great investor started exactly where you are.
You aren't trying to pass a CPA exam. You're just trying to become an informed owner. You want to see if the company is growing for the right reasons, if their profits are real, if they have their debt under control, and if the CEO respects the shareholders' money.
It gets so much easier once you treat the statements like an interconnected story. The income statement makes a bold claim about how great the year was. The balance sheet proves whether they have the foundation to back it up. The cash flow statement is the lie detector that proves if that success turned into real money.
On your first pass, just look at the big picture: revenue, margins, debt, share count, and cash flow over a few years. On your second pass, look for the weird stuff, check the footnotes, and see if management’s story matches the reality. You aren't looking for a flawless company; you're just looking for one that makes sense.
No spreadsheet will ever tell you exactly how loyal a company's customers are, or how brilliant their culture is. But it will absolutely show you where the cracks are starting to form. Learn to follow the cash, respect the balance sheet, and constantly ask "why" when a number suddenly changes. Once you build that habit, these dense, boring documents transform into something powerful: the unfiltered truth about how a business works.
Sources and further reading
Editorial revision: 7 October 2026. Numerical scenarios are hypothetical unless identified as historical. References support the added explanations and selected corrections; rules and product terms should be checked again before acting.