
Earnings per share and the price-to-earnings ratio offer a compact way to relate a company's profit to its share price. Their apparent simplicity hides choices about the earnings period, accounting adjustments, dilution, and the durability of profit. A low P/E can indicate a modest valuation, but it can also reflect unusually high earnings that are unlikely to last. The ratio needs a business explanation.
1. EPS: The Profit Behind Each Share
Before you can figure out if a stock is cheap or expensive, you have to know if the company is making money. That’s where EPS, or Earnings Per Share, comes in. Here's a quirk, though: EPS can go up even if a company's total profit is completely flat, just by the company buying back its own stock. Conversely, EPS can drop if they issue new shares, even if they're making more money. You always want to look at both the net income and the "diluted" share count. And make sure to strip out one-time gains or random charges. A clean-looking EPS number can easily hide a weird, isolated event that's never going to happen again.
Basically, EPS tells you exactly how much of the company’s profit belongs to each individual share you own.
The formula: Net Income ÷ Number of Shares Outstanding = Earnings Per Share
Let's say a company makes $10 million in profit this year and has 10 million shares floating around. Divide the profit by the shares, and your EPS is $1. Every share you own represents a one-dollar claim on that year’s earnings.
The classic pizza analogy works perfectly here. The company’s total profit is the pizza. The shares are the slices. If you cut it into 10 slices, everyone gets a decent piece. If management suddenly cuts that exact same pizza into 20 slices, your piece gets smaller. The pizza didn’t shrink, but your share of it did.
That’s why the sheer number of shares is a huge deal. A company can boast about growing its total profits, but if they keep issuing new shares to do it, shareholders still lose out. This is called dilution. It basically means your piece of the pie is shrinking.
The reverse is true, too. When a company buys back its own stock and retires those shares, there are fewer slices. If profits just stay flat, EPS still goes up because each remaining share suddenly owns a bigger chunk of the business.
Why EPS matters: A rising EPS usually means the business is getting more profitable on a per-share basis, which is the only basis that matters to you. Companies love to put out press releases about "record revenue," but if EPS is flat or falling, you aren't really benefiting from those headlines.
Just don't look at EPS in a vacuum. Selling off an old warehouse, getting a tax break, or aggressively cutting costs can create a temporary EPS spike. Always look at the trend over three to five years. Anyone can have a lucky quarter; a steady, multi-year upward trend is what matters.
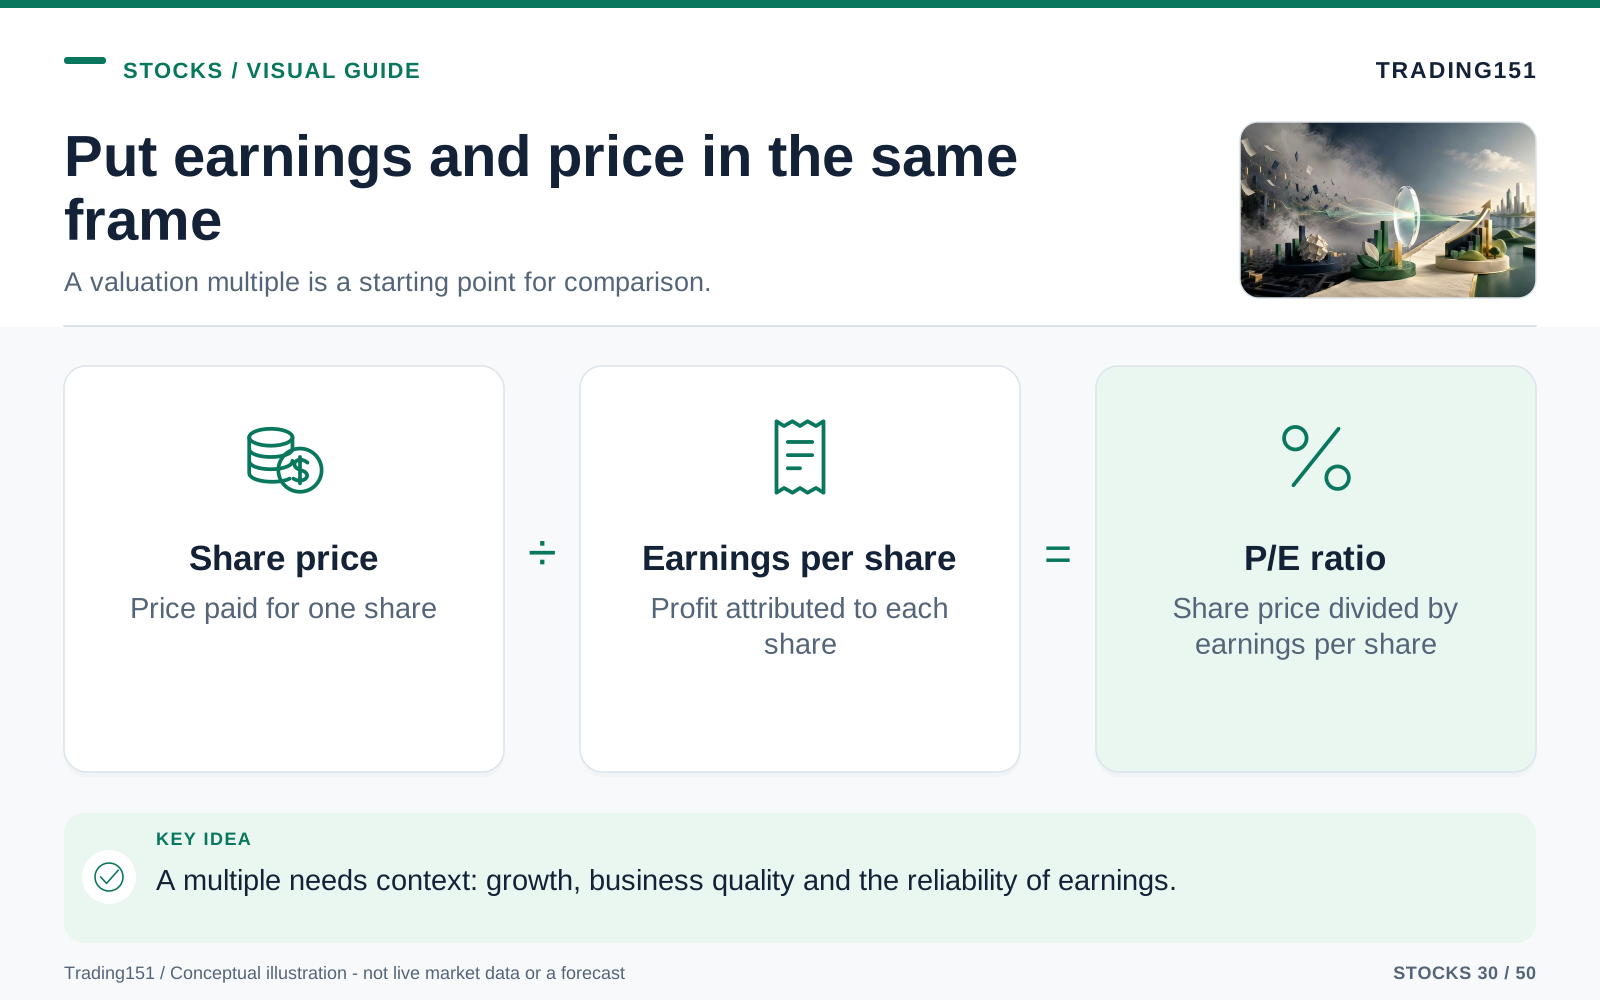
Read this diagram as text
- Share price
- Price paid for one share
- Earnings per share
- Profit attributed to each share
- P/E ratio
- Share price divided by earnings per share
2. P/E Ratio: How Much Are You Paying for Those Earnings?
Once you get EPS, the P/E ratio is a breeze. P/E stands for Price-to-Earnings. It simply tells you what the market is willing to pay for every $1 of a company’s earnings.
The formula: Current Share Price ÷ Earnings Per Share = P/E Ratio
If a company earns $5 per share and its stock is trading at $100, the P/E ratio is 20. Strip away the finance jargon, and it just means people are currently paying $20 to get $1 of annual earnings.
That simple number gives you a really quick read on the market's mood. A low P/E might mean the stock is a screaming bargain, or it could mean everyone thinks the business is doomed. A high P/E could mean the stock is ridiculously overpriced, or it might just mean investors are expecting large growth.
Think about buying a local coffee shop. If it brings in $100,000 a year in profit and the owner wants $1 million for it, you’re paying 10 times earnings. If they suddenly ask for $5 million, you're paying 50 times earnings. You’d probably pause and ask some hard questions before writing that $5 million check.
The stock market is the same concept—just with a lot more noise, constantly flashing numbers, and millions of people arguing on the internet about what the future holds.
Trailing P/E vs. Forward P/E
When you look up a ticker, you'll usually see two different P/E numbers. Forward estimates are great because the stock market is always looking ahead, but they’re heavily influenced by human optimism. Wall Street analysts are notorious for revising their forecasts after things start going south. This means a stock can look cheap based on next year’s projections, right up until those projections get slashed. It always helps to look at management's history of hitting goals and see what happened to their estimates during the last recession.
- Trailing P/E uses the actual earnings from the last 12 months. It’s grounded in cold, hard reality, but it’s looking in the rearview mirror.
- Forward P/E uses projected earnings for the next 12 months. It's helpful for figuring out where the company is going, but it relies entirely on forecasts—and forecasts are frequently wrong.
Neither is flawless. A trailing P/E can make a company in the middle of a turnaround look substantially expensive just because last year was terrible. A forward P/E can make a hyped-up tech stock look reasonable based on large growth assumptions that might never actually happen.
The Trap of Thinking Low P/E Always Means Cheap
It’s common for new investors to learn about the P/E ratio and immediately start hunting for single-digit numbers. We all love a bargain. But in the stock market, the cheapest-looking stuff is rarely a bargain.
A company trading at a P/E of 5 might be a hidden gem. Or, it might be a dying business with plunging sales, suffocating debt, and a product nobody wants anymore. The market usually pushes a price down that low for a very good reason. We call this a value trap: it looks cheap today, but it’s going to get even cheaper tomorrow because the core business is actively falling apart.
Flip it around—a P/E of 40 isn’t automatically a rip-off. If earnings are doubling and the company has years of expansion ahead, paying a premium makes total sense. That doesn’t mean you should just blindly buy high-P/E stocks. It just means the number is useless without context.
The best question you can ask yourself is: What has to happen for this P/E ratio to make sense? If the answer is "they have to execute flawlessly, grow forever, and face zero competition," you're probably paying for a fairy tale.
3. PEG Ratio: Adding Growth to the Picture
If P/E tells you what you’re paying for today's earnings, the PEG ratio asks a much better question: how much are you paying for the company's growth?
PEG stands for Price/Earnings-to-Growth.
The formula: P/E Ratio ÷ Annual EPS Growth Rate = PEG Ratio
Let’s look at two totally different companies to see why this matters.
- Boring Utilities Inc. has a P/E of 12 and grows its earnings by about 4% a year. Its PEG ratio is 3.0.
- Rocket Software Co. has a steep P/E of 30, but it's growing earnings at 35% a year. Its PEG ratio is roughly 0.86.
At first glance, the utility company looks way cheaper. But once you factor in growth, the software company might be the better deal. Yes, you are paying a higher premium for today's earnings, but you are getting explosive growth in return.
As a very rough rule of thumb, a PEG around 1.0 implies a stock is fairly valued. Under 1.0 points to a potential bargain, and over 1.0 suggests it might be overpriced. But please, treat this as a loose guideline, not physics. Growth estimates are educated guesses, and a tiny tweak to those guesses will substantially swing the PEG ratio.
PEG really shines when you're comparing two companies in the same industry. It falls apart if you try to cross-compare. Valuing a slow-moving regional bank against a hyper-growth AI startup using the same yardstick just doesn't work.
The fatal flaw of PEG is its reliance on future predictions. If analysts are wearing rose-colored glasses, the PEG ratio will make the stock look like a steal. Always step back and ask if the growth rate passes the smell test. A company growing at 40% a year right now is going to have a really hard time keeping that pace up forever.
4. P/B Ratio: What Is the Business Worth on Paper?
The Price-to-Book ratio, or P/B ratio, pits a company’s stock price against its accounting book value.
Think of book value as a company’s net worth on paper. You take everything they own (assets), subtract everything they owe (liabilities), and what’s left is the book value. Theoretically, if the company shut down tomorrow, sold all its stuff, and paid off its debts, this is what the shareholders would get to split.
The formula: Market Price per Share ÷ Book Value per Share = P/B Ratio
A P/B of 1 means the stock market values the company exactly at its accounting net worth. A P/B under 1 means it's trading for less than the sum of its parts. That can be a screaming buy signal, but more often, it's a large red flag that investors think the company's assets are either overvalued on the balance sheet or just not capable of generating real returns.
P/B is highly effective for companies that rely on heavy, physical, or financial assets—think banks, insurance companies, real estate trusts, and traditional manufacturing. For a bank, the balance sheet is the entire business, so book value is a fantastic anchor.
But for modern, asset-light companies? P/B is pretty much useless. A tech firm doesn’t need large factories or fleets of trucks. Its real value is tied up in things you can't easily put on a balance sheet: proprietary code, brand loyalty, network effects, and smart employees. Traditional accounting completely misses this stuff. Because of that, a phenomenal software company is always going to look obscenely expensive on a P/B chart.
Before you even calculate P/B, ask yourself: Does this business make money using physical and financial assets, or from intangible ideas and tech? If it’s the latter, skip the P/B ratio entirely.
5. Free Cash Flow: The Money a Company Can Use
Accounting profits are great, but cash flow usually tells a much more honest story.
A company can report a healthy profit while quietly running out of money to pay its bills. Or, it can look totally unprofitable on paper due to weird accounting rules, while silently raking in mountains of cash. This is why serious investors obsess over Free Cash Flow (often shortened to FCF).
Free cash flow is the actual cash left in the register after a company pays for its day-to-day operations and buys whatever equipment it needs to keep the lights on. This is the ultimate discretionary fund. It’s the money they can use to pay dividends, buy back stock, pay down debt, or buy out a competitor.
A simple version of the formula: Operating Cash Flow − Capital Expenditures = Free Cash Flow
If EPS is the PR spin a company puts on its income statement, free cash flow is the cold, hard cash hitting the bank account at the end of the month. It’s an old saying on Wall Street: earnings are an opinion; cash is a fact.
Large free cash flow gives a business options. They can weather nasty recessions, invest heavily while competitors are struggling, and reward shareholders without taking on toxic debt. Poor cash flow traps a company in a corner, forcing them to borrow, dilute their shareholders, or scrap important projects just to survive.
Price-to-Free Cash Flow
Price-to-Free Cash Flow, or P/FCF, is basically the P/E ratio's grittier, more realistic cousin. Instead of checking the price against paper earnings, you check it against actual cash generation.
If a stock has a significantly lower P/FCF than its rivals, you might have found a great deal—especially if that cash flow is consistent. But context is everything. A rock-bottom P/FCF usually means the market is convinced that the cash spigot is about to dry up. Conversely, a high P/FCF isn't necessarily bad if the company is pouring money into projects that will generate even more cash down the line.
FCF is your best friend when evaluating mature companies. If a business constantly claims to be highly profitable but never actually seems to generate any spare cash, looking at the FCF will quickly expose the illusion.
6. P/S Ratio: Useful When Profits Have Not Arrived Yet
Plenty of companies—especially in the startup and hyper-growth tech phases—don't make a profit yet. And if earnings are zero or negative, the P/E ratio totally breaks down. You can't value a business based on profits that don't exist.
When you hit that wall, you turn to the Price-to-Sales ratio, or P/S ratio.
The formula: Market Capitalization ÷ Annual Revenue = P/S Ratio
The P/S ratio just compares the entire market value of the company to the total revenue it brings in. If a company is worth $10 billion and does $2 billion a year in sales, its P/S is 5.
You’ll see this metric everywhere in industries where companies are intentionally losing money to fund large expansions. They are burning cash on marketing, R&D, and building out infrastructure, figuring they will capture the market now and turn a profit later. When that's the strategy, investors focus on revenue growth and worry about the bottom line later.
But be careful: sales and value are not the same thing. Revenue only matters if the company can eventually squeeze a profit out of it. Any idiot can sell a dollar for ninety cents, show large revenue growth, and completely destroy the company in the process.
If you're going to use P/S, only compare companies with very similar profit margins and business models. A software company that keeps 80 cents of every dollar in gross profit deserves a massively different P/S ratio than a grocery store that keeps 2 cents. Not all revenue is created equal.
The killer question here is: When this company finally matures, what kind of profit margin can it realistically achieve? If you don't have a good answer for that, don't pay a premium just because sales are going up.
7. Dividend Yield: Income, Signal, or Warning Sign?
Dividend yield tells you exactly how much cash a stock pays you just for holding it, relative to its current price.
The formula: Annual Dividend per Share ÷ Current Share Price = Dividend Yield
If a stock costs $100 and pays out $4 a year in dividends, you’re looking at a 4% yield.
For people investing for income, dividends are the ideal. It’s tangible cash you can spend, save, or use to buy more stock. Plus, when the market is trading sideways or totally crashing, getting a steady cash deposit every quarter makes it a lot easier to stay calm and hold on.
But a huge dividend yield is not always a gift. In fact, it’s often a trap. The yield goes up when the stock price goes down. If a stock crashes because the business is in deep trouble, the yield might mathematically look large, but the market is basically screaming that a dividend cut is coming. If a company is paying out way more cash than it can afford, that dividend is living on borrowed time.
This is why smart income investors always check the payout ratio, which compares the dividend payment to the company's earnings or free cash flow. If a company is only paying out a comfortable fraction of its cash, the dividend is safe and has room to grow. If they are scraping the bottom of the barrel to maintain the payout, disaster is looming.
A great dividend is backed by strong cash flow, a manageable debt load, and an adaptable business model. A toxic dividend is just a PR stunt meant to keep angry investors from jumping ship while the company sinks.
8. Enterprise Value: Looking Beyond the Stock Price
Most people glance at market capitalization (share price multiplied by total shares) and stop there. Market cap tells you what the stock market thinks the equity is worth, but it leaves out a large piece of the puzzle. What happens if two companies finance themselves in completely different ways? A company loaded with debt might look small based on market cap, but once you factor in what they owe, their true price tag is enormous. Cash has the opposite effect, effectively acting as a discount—though remember, a business always needs some cash tied up just to keep operations running.
Enterprise Value, or EV, gives you the full, unvarnished picture. It adds the debt and subtracts the cash, giving you a rough estimate of what it would cost to buy the entire business outright, pay off its lenders, and pocket its bank accounts.
A simple version of the formula: Market Capitalization + Debt − Cash = Enterprise Value
This distinction is huge. You could have two companies with identical market caps, but totally different financial realities. Company A might be sitting on piles of cash and zero debt. Company B might be drowning in heavy debt. Market cap calls it a tie. Enterprise value clearly shows you that Company B is a much riskier, much more expensive proposition.
Investors love using EV/EBITDA to compare companies. It measures enterprise value against earnings before interest, taxes, depreciation, and amortization. It’s a great equalizer if you're trying to compare companies that have radically different debt loads or tax setups.
EV isn't flawless, but if you’re looking at capital-heavy sectors like telecom, energy, airlines, or manufacturing, ignoring debt is a surefire way to get burned.
9. Margins and Return on Capital: Quality Matters Too
Valuation isn’t just a hunt for the cheapest stock. You also have to care deeply about the quality of what you’re buying.
Two stocks can have the same P/E ratio, but one is clearly superior. Why? Because the better company has fatter profit margins, the power to raise prices without losing customers, zero crippling debt, and a brilliant track record of making money off the cash it reinvests.
Profit margin shows how much of a sales dollar becomes profit. If a company has a 20% net margin, they pocket 20 cents for every dollar that comes through the door. A company with a 2% margin is surviving on crumbs, keeping just 2 cents.
Return on invested capital (often called ROIC) measures how good the company is at turning cash into even more cash. Companies with sky-high ROIC are the ideal of investing because they can compound their value for decades without having to borrow large sums of money to grow.
This is where valuation turns into an art. A mediocre business trading at a dirt-cheap price can absolutely make you money. A fantastic business trading at a fair price can make you rich over time. But overpaying for a terrible business? That's how you blow up your portfolio.
Cheapness alone isn't enough. Stop asking Is this stock cheap? and start asking Is this stock cheap compared to the quality of business I'm getting?
10. Comparing Companies the Right Way
A valuation ratio is meaningless in a vacuum. A P/E of 18 tells you absolutely nothing until you stack it up against the company's past, its competitors, and the broader market. And comparing peers only works if they make money in similar ways. Don't lump a high-margin software platform, a laptop manufacturer, and an IT consulting firm together just because they're all labeled tech companies. You have to look at how much capital they require, how cyclical their sales are, and their accounting choices before treating an industry average as a fair benchmark.
Start by looking in the rearview mirror. Has this stock historically traded around a 15 P/E, but suddenly it's at 30? Investors might be anticipating a large growth spurt, or the stock might just be unusually overhyped. What if it usually sits at 25, and now it's at 12? You might have stumbled on a bargain, or the core business might be completely broken.
Next, compare it to true peers. Measure a railroad against other railroads. Compare a regional bank to other regional banks. Trying to benchmark a hyper-growth cloud software stock against a sleepy public utility is a waste of your time.
You also have to respect the industry's natural baseline. Some sectors always trade at low multiples because they are notoriously cyclical, require billions in equipment, and grow at a snail's pace. Other sectors command large premiums because they offer high margins, recurring subscriptions, and decades of runway.
Good valuation isn't about memorizing the "correct" number. It's about looking at the current price tag and asking: Given this specific business, in this specific industry, at this stage in its life... Does this make sense?
11. Common Valuation Mistakes to Avoid
The quickest way to get in trouble is treating one metric like a magic 8-ball. A low P/E is not an automatic buy. A high P/E is not an automatic sell. A fat dividend yield doesn't guarantee safe income, and a low P/S doesn't mean a stock is undervalued.
The second major mistake is totally ignoring debt. A stock can look unbelievably cheap on an earnings basis, but be fragile because all of its cash is being swallowed by interest payments. Debt acts like a multiplier: it makes good times great, and bad times fatal.
Third, don't forget that economic cycles are real. Companies tied to commodities, homebuilding, autos, and banking often look cheap right at the peak of an economic boom because their current earnings are temporarily bloated. Conversely, they look most expensive right at the bottom when earnings are wrecked. For cyclical stocks, a traditional P/E ratio is basically a trap.
Fourth, stop treating Wall Street forecasts like undisputed facts. Analyst estimates are helpful, but they are just educated guesses. A stock might look like a great deal based on next year's earnings, but if those earnings never materialize, that "great deal" is going to crash.
Finally, never confuse a world-class company with a world-class stock. A business can be run perfectly and still be a miserable investment if the stock price is already factoring in unrealistic expectations. Quality is absolutely vital, but the price you pay still dictates your return.
Putting It All Together: Build a Valuation Mosaic
No single metric holds all the answers. Think of them as different camera angles on the same subject.
- EPS tells you the profit tied to your specific share.
- P/E reveals what the crowd is willing to pay for those profits.
- PEG factors in how fast the company is growing.
- P/B grounds you in physical asset reality.
- Free cash flow exposes the actual, spendable cash being generated.
- P/S acts as a stand-in when profits haven't shown up yet.
- Dividend yield highlights the cash payout, demanding a quick reality check on sustainability.
- Enterprise value forces you to face the reality of the company's debt and cash.
When you put them all together, a real picture emerges. One data point is useless. But layered together, they'll tell you if a stock is fairly priced, absurdly expensive, or dangerously cheap.
If you want to keep it practical, always start here:
- Are revenue, earnings, and free cash flow growing?
- Are profit margins expanding, holding steady, or shrinking?
- Is the balance sheet a fortress, or is debt a ticking time bomb?
- How does the price compare to its direct rivals?
- How does today's valuation compare to where this stock normally trades?
- What kind of future is already baked into today's price?
That last question is arguably the only one that truly matters. Every stock price is essentially a story about the future. Sometimes the market is terrified. Sometimes it's euphoric. Your job as an investor is simply to read the story the price is telling, and decide if you believe it.
Make the numerator and denominator tell the same story
If a share costs $60 and annual earnings per share are $3, the P/E is 20. That calculation is clear only after identifying which earnings figure is being used. Trailing reported earnings, management-adjusted earnings, and an analyst's estimate for next year can produce different ratios for the same share on the same day.
Check diluted rather than only basic earnings per share when potential dilution is material. Options, share-based compensation, or convertible securities can affect the claim represented by each share, subject to accounting rules. A company can grow total profit without producing the same growth in earnings attributable to an existing share.
Unusual items require judgment rather than automatic removal. A genuinely one-off charge may obscure ongoing operations, but repeated restructuring charges or recurring compensation expenses should not be dismissed merely because management excludes them from an adjusted measure. Reconcile the adjustment with reported results and ask whether the economic cost is likely to return.
For cyclical businesses, test earnings across less favorable conditions. A low P/E near peak profits can be more expensive than it looks, while a high or unavailable P/E during a downturn can conceal a different situation. Use cash flow, debt, and industry economics alongside the ratio. The purpose is not to find the smallest number; it is to understand what level of sustainable earnings the purchase price assumes.
Reconcile the earnings figure before using the multiple
Two P/E ratios can differ because they use different share prices, earnings periods, or definitions of profit. Trailing reported earnings, forward estimates, and adjusted earnings are not interchangeable denominators. Identify which one is being used before comparing companies.
An adjustment may be informative, but recurring exclusions deserve scrutiny. Ask whether the cost really is unusual and whether it affects the cash available to shareholders. A low multiple on an optimistic estimate is not the same as a low multiple on durable earnings already demonstrated. The calculation is simple; the work lies in deciding whether the earnings figure is representative and comparable. 1
Valuation Is a Range, Not a Magic Number
Wrapping your head around valuation can feel intimidating at first. The jargon sounds complex, the spreadsheets look dry, and financial networks love throwing ratios around without explaining them, making you feel like you're completely out of the loop.
But valuation isn't a dark art reserved for guys in custom suits. It's just a common-sense, disciplined way of asking what a business is worth, and whether paying today's price is a smart move.
Start small. Pick a company you already interact with. Maybe it's the brand that makes your smartphone, the warehouse club where you buy groceries, or the software you stare at all day at work. Look up its EPS. Glance at the P/E ratio. See how it stacks up against its competitors. Check if it’s generating free cash flow. Connect the dots and see if the numbers on the screen match your real-world experience as a customer.
Valuation isn't a race to find the lowest possible number. It's an honest attempt to connect today's price tag with tomorrow's uncertain cash flows. The ratios just help organize your thoughts. The real magic happens when you apply your own judgment about a company's growth, its competitors, and the amount of risk you're willing to take.
Look through multiple lenses. Earnings work great for a large consumer brand, book value is perfect for a bank, sales metrics help map out an early-stage startup, and free cash flow is the ultimate truth-teller when accounting gets weird. When these metrics contradict each other, don't just average them out and call it a day—dig in and figure out why they disagree.
A good valuation ends in a range of possibilities, not a hyper-specific price target. Figure out what the market is expecting, map out what has to go right, and know exactly what would make you sell. You can never completely eliminate uncertainty from investing, but understanding valuation ensures that your excitement never turns into a willingness to overpay.
Sources and further reading
Editorial revision: 7 October 2026. Numerical scenarios are hypothetical unless identified as historical. References support the added explanations and selected corrections; rules and product terms should be checked again before acting.