
Order blocks and liquidity grabs are charting terms used in several price-action frameworks. They can describe areas of interest or a move beyond a previous high or low, but the chart alone does not identify the orders of a particular bank or prove deliberate stop hunting. A more reliable approach is to define the visible pattern, state the proposed explanation as a hypothesis, and test the trading rule separately.
Part 1: Why the Market Seems to Target Obvious Levels
—You have to change how you look at the chart. The market doesn't move just because a neat little head-and-shoulders pattern showed up. It moves because buy and sell orders have to be matched. That’s the rule, whether you’re trading a $500 retail account or moving billions for a hedge fund.
What liquidity really means
Liquidity concerns the ability to trade at the required size without an unacceptable price impact. Stops and breakout orders may cluster near visible levels, but a chart does not reveal their complete size or ownership. Triggered stop-market orders can increase demand for liquidity rather than provide resting limit liquidity. A move through a level can continue, reverse, or do very little.
As a retail trader, you don't really feel this. You click buy, your order fills instantly, and the market doesn't even blink. But for a large institution, it’s a complication. They can’t just drop a 10,000-lot order at market price without slippage ruining their average entry. If a bank wants to buy a lot of GBP/USD, they need an equally large amount of people willing to sell it to them.
Previous highs and lows are plausible places to investigate because traders may use them in entry and exit rules. The actual concentration of orders is not visible from a retail price chart alone. Treat a marked level as a research hypothesis rather than a confirmed map of the global order book.
A brief move through a prior high or low can occur for several reasons, including changes in quotes, stop activation, news, or temporary imbalances in available liquidity. The subsequent reversal does not, by itself, prove that an institution deliberately caused it.
Where liquidity usually sits
If you want to read price action this way, start asking yourself one simple question when you open your charts: where are the most obvious stop losses sitting right now?
Usually, they're piled up around previous day highs and lows, Asian session extremes, equal highs and lows, and clean trendlines. Because these levels are so obvious to everyone, they become the perfect hunting ground for liquidity.
Now, this doesn't mean every wick is "manipulation" or some evil smart money algorithm out to get you. It just means when price gets near these zones, you need to stop thinking of them as unbreakable walls of support and resistance. Instead, think about what the market might be trying to collect before it makes its next move.
The anatomy of a liquidity grab
A liquidity grab happens when price pushes through one of these key levels, triggers a bunch of resting orders, and baits emotional traders into jumping in at the worst possible second.
Picture this: a support level has been holding all morning. It looks like a concrete floor. Long traders confidently tuck their stops just below it. Breakout traders set their sell stops, hoping to catch the drop. Suddenly, price violently stabs through the floor. Stops are hit, new shorts pile in, and panic takes over.
Then, just as fast as it dropped, the move dies. Price whips right back above support, reclaims the level, and takes off in the opposite direction.
After such a reversal, the observable facts are the break below support and the return above it. A trader may hypothesize that stop activation and aggressive buying contributed, but the chart alone cannot identify the participants, their position sizes, or their intentions.
Visible levels can attract trading interest without being deliberate bait. Record what happened around the level and compare many similar events before deciding whether it offers a usable signal.
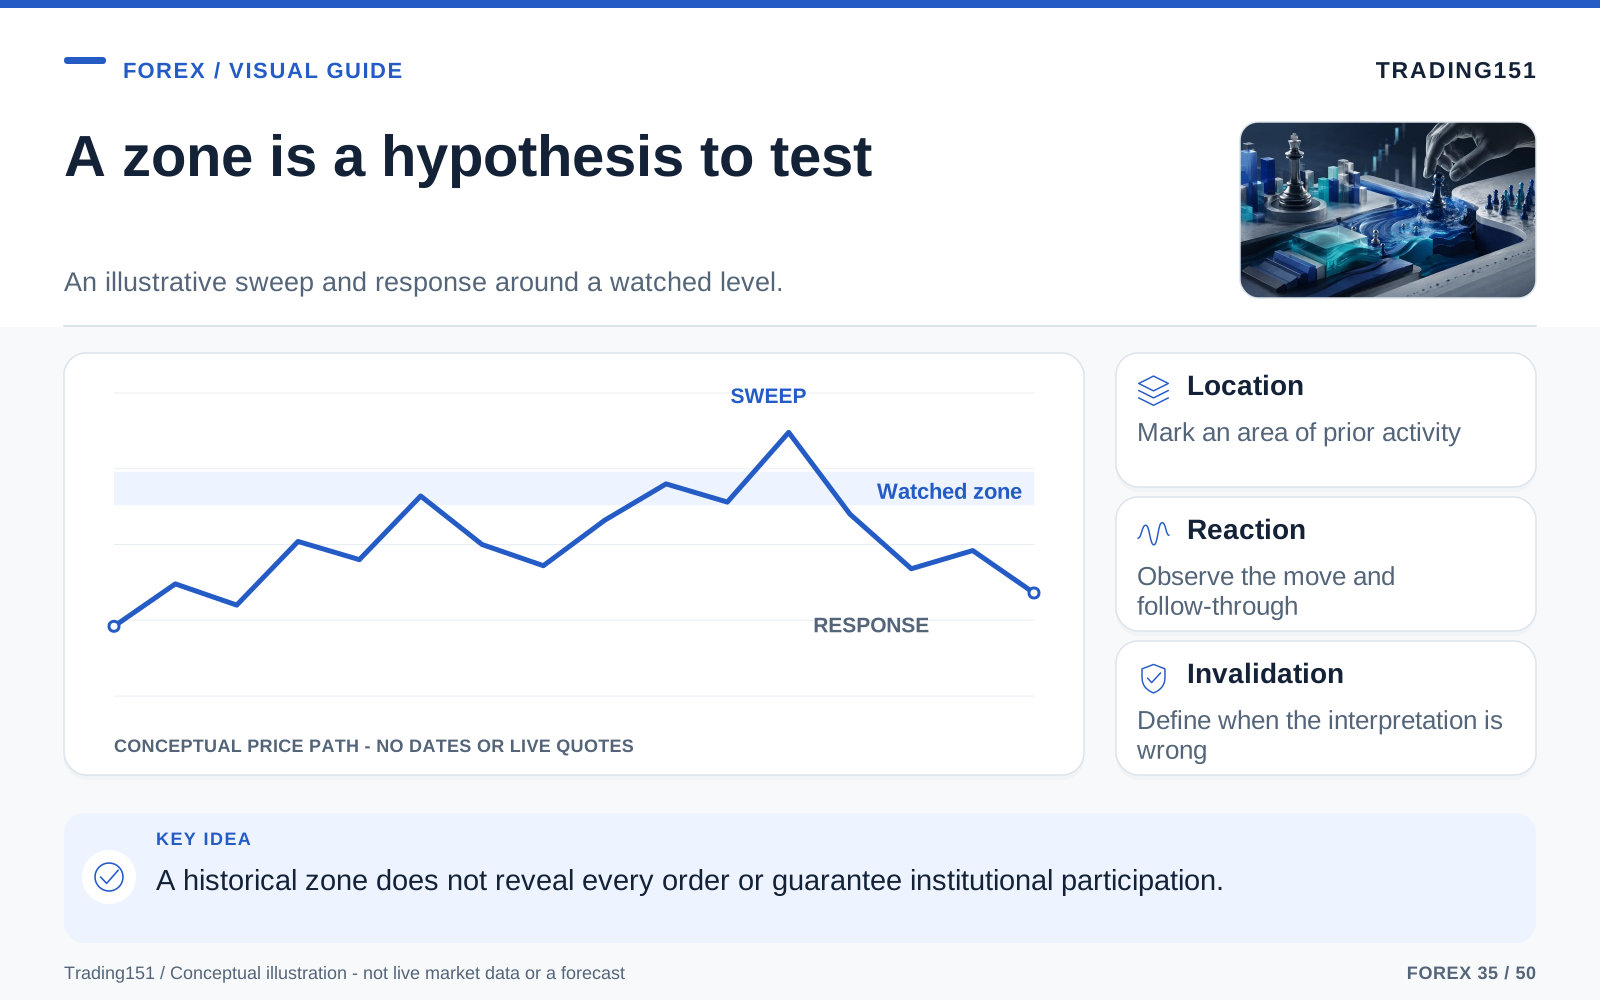
Read this diagram as text
- Location
- Mark an area of prior activity
- Reaction
- Observe the move and follow-through
- Invalidation
- Define when the interpretation is wrong
Part 2: Order Blocks and What They’re Supposed to Represent
Order-block analysis adds a proposed retracement area to that price-action framework. It does not establish that the market must return there after a move through a prior level.
That’s where order blocks come in.
A plain-English definition
If you read a textbook on SMC, a bullish order block is defined as the last bearish candle before a strong upward move that breaks market structure. A bearish order block is the opposite. Traders argue endlessly over this—whether to use the wick, the body, or how big the push away needs to be. Don't get bogged down in finding the "perfect" label. Pick a clear definition that works for you, mark the zone, and see how price reacts. Consistency beats trying to draw the prettiest box on a hindsight chart.
The framework interprets the selected candle as a possible area of concentrated activity before repricing. The candle does not prove where institutional positions began or whether any orders remain unfilled.
Try to think of it less like a magical candle that repels price, and more like a footprint in the mud. The market didn't just explode out of nowhere. There was an origin point where buying completely overwhelmed selling, and that's an area the market might want to revisit.
Why price comes back to these zones
In SMC terminology, 'mitigation' is a proposed explanation for a return to an earlier price area. It may be described as participants completing orders, adjusting hedges, or changing positions. Those are possible mechanisms, not facts that can be recovered from the candle pattern alone.
A return to a marked zone may produce a reaction, continue through it, or never occur. Claims about its reliability need a consistent definition and a record of both successful and failed setups. A persuasive explanation is not a substitute for that evidence.
Ultimately, order blocks are just highly refined supply and demand zones. They aren't arbitrary rectangles drawn after the fact; they are attempts to pinpoint exactly where the market made a major repricing decision.
Not every candle qualifies
A lot of newer traders fall into the trap of being way too mechanical with this. They hear "last down candle before the up move" and suddenly their charts look like a checkerboard of random rectangles.
A good order block needs a storyline. It should be sitting near liquidity, the move away from it should look urgent, and it needs to break structure. If price just slowly drifts away from a candle and nothing important happens, that block is probably useless.
Here’s what the really good ones have in common:
- A liquidity sweep. The setup usually starts right after price runs a major high or low and clears out stops.
- Real displacement. The move away shouldn't look sluggish. You want big, bold candles that show real aggression.
- Imbalance: Some traders require a defined fair value gap beside the block. This describes the relationship between selected candles; it does not prove which institution traded or that the gap must later close.
- A true structure break. The move needs to accomplish something—like taking out a major swing point, not just wiggling around in the noise.
Without those factors, you're just drawing boxes. With them, you have a solid trade thesis.
Part 3: The Relationship Between Liquidity, Displacement, and Structure
The fastest way to lose money with SMC is treating these concepts like isolated party tricks. You spot a long wick and assume it's a sweep. You see a random candle and call it an order block. You zoom into a 1-minute chart, find a tiny higher high, and call it a structure shift. Then you get stopped out and wonder why. You have to establish some baseline rules. What constitutes a sweep for the pair you're trading? What timeframe are you basing structure on? If you don't define this stuff upfront, you can trick yourself into seeing a setup on any chart.
In the real world, these concepts only work when they team up.
Liquidity is the trigger
The sweep is the spark. It clears out the resting orders and grabs the fuel needed to move the market. It’s the market reaching its hand into a pocket of liquidity.
Displacement is the proof
Once the fuel is grabbed, you want to see an explosion. If price sweeps a low and just kind of bounces lazily, you don't have proof that anything changed. But if it rockets away and leaves a glaring imbalance on the chart, that’s your signal that the sweep was legit.
Structure is the confirmation
This is the part everybody skips: you have to wait for structural confirmation.
Just because price sweeps a low and bounces doesn't mean a downtrend is over. The market has to prove it by breaking a relevant swing high. That structure shift is what separates a tiny pullback from a full-blown change in direction.
Only after you see that entire sequence play out does the order block matter. The order block is the very last piece of the puzzle that turns a good story into an actual entry point.
Part 4: A Practical Workflow for Trading Order Blocks
The goal isn’t to play fortune teller and catch every market top or bottom. The goal is to build a routine that stops you from panic-buying every big green candle you see.
Step 1: Start with the higher timeframe
Zoom out. Check the daily, 4-hour, or 1-hour chart. What is the market doing? Is it trending hard, or stuck in a choppy range? Is it creeping up on a large weekly resistance level?
Lower-timeframe setups are fragile if they're fighting the bigger picture. A beautiful 5-minute bullish order block means absolutely nothing if it’s printing right underneath a large daily supply zone.
Step 2: Mark obvious liquidity
Before you even think about looking for an entry, figure out where the market is most likely heading to hunt orders. Mark your equal highs, equal lows, previous day extremes, and obvious swing points.
Just doing this one thing will completely change how you trade. Instead of reacting emotionally to every candle, you start sitting on your hands until price reaches a zone that matters.
Step 3: Let the sweep happen
This is where your patience gets tested. Don't try to front-run the sweep. Let the market run the level. Watch the breakout traders get trapped. Wait for the chart to show you that liquidity has been absorbed.
Most losing SMC trades happen because the trader jumped in before the sweep, instead of after.
Step 4: Wait for displacement and structure shift
Once the level gets raided, watch how the market reacts. You want to see price snap back violently and break a local swing level. That’s the market tipping its hand, telling you the sweep was the main event, not the start of a new trend.
If price just keeps bleeding through the level and never shifts structure, there’s no trade. And that’s a good thing—you just saved yourself a loss.
Step 5: Identify the order block
Now that the trap is set and the trend has shifted, look back at the origin of the move. Find the candle that kicked off the displacement.
Mark the zone. Whether you use the whole candle, just the body, or the 50% mark doesn't really matter. Pick a method and stick to it so your brain knows exactly what it's looking for.
Step 6: Let price come back to you
Traders hate this step because it requires serious restraint. When you see price ripping away from your zone, the FOMO kicks in and you want to chase it. Don't. The highest probability entries happen when price comes back to retest the order block, not during the initial frenzy.
You can set a limit order right on the block, or wait for price to tap the zone and show lower-timeframe confirmation. Both work, provided the larger narrative is correct.
Step 7: Place the stop where the idea is invalid
Your stop loss shouldn't be based on how much pain you can tolerate, and it definitely shouldn't be random. Place it where your trade thesis is completely busted. If price pushes deep through your order block and holds there, the setup failed. Period.
This is why you have to adjust your position size properly. Don't widen your stop just to give the trade "room to breathe." Keep the stop structural, and size your lot accordingly.
Step 8: Aim for real targets
Don't just aim for a random 1:3 risk-to-reward ratio. Look for the next logical liquidity pool. Where are the un-swept highs? Where is the obvious imbalance?
The best trades offer clear asymmetry: your stop is tucked tightly behind a secure invalidation point, and your target is miles away at a magnetic liquidity pool.
Part 5: A Walkthrough of a Classic Setup
Let’s paint a picture of how this looks.
Say EUR/USD has been climbing steadily on the 4-hour chart. During the Asian session, it just chops sideways in a tight, obvious box. Everyone sees it. That means retail traders are tucking stops above and below that box.
London session opens, and price suddenly plummets below the Asian lows. Early buyers are stopped out. Momentum traders confidently hit "sell." Twitter starts buzzing about how EUR/USD is crashing.
But the crash stalls. Price sharply reverses back into the Asian range and rips higher with large momentum, closing above a recent swing high. The narrative has completely flipped. Liquidity was taken, the reaction was fierce, and structure broke bullish.
You look at your chart, find the last bearish candle before that large rally, and draw your box. That’s your bullish order block.
Then price does that annoying thing where it starts slowly bleeding lower. The breakout buyers start sweating and closing early. But price isn't crashing—it’s just pulling back to mitigate your order block. It taps your zone, catches a bid, and resumes the uptrend right into the next pool of liquidity.
That entire sequence is what makes the trade beautiful. It’s not just a random box on a chart. It’s the full story: trap, shift, return, and go.
Part 6: Why Traders Still Struggle Even After Learning This
A lot of tutorials skip over the hard truth: knowing what an order block is and trading it profitably are two totally different skills.
FOMO ruins good analysis
The initial move after a liquidity sweep is usually aggressive, and human nature makes you want to jump on the moving train. When price eventually pulls back into the order block, it feels like a betrayal, even though it’s exactly what you mapped out.
Chasing big candles will destroy your account faster than anything else. Yes, sometimes price will leave without you. It sucks. But missing a trade is infinitely cheaper than buying the top and getting stopped out on the retracement.
Traders treat probability like certainty
Order blocks aren't impenetrable brick walls. Liquidity grabs fail. News events will blow right through your pristine technical setups. The big banks don't all hold hands and agree on where price should go.
SMC is a fantastic way to organize and read price action, but if you treat it like an infallible religion, you're going to get hurt.
Everything looks like an order block after the fact
Hindsight is a liar. It’s so easy to scroll back, find a large reversal, circle a candle, and say, "Boom, perfect order block." But trading live is messy. There are often two or three zones right next to each other. Sometimes price reacts to the wick, sometimes the body, and sometimes it misses your entry by a single pip. If you want to get good at this, use a bar replay tool. Blindfold yourself to the right side of the chart. Mark your zones and see how often price just ignores them. Studying the failures is what builds realistic expectations—and you won't find those messy failures in most YouTube trading gurus' perfectly curated examples.
This is why screen time matters. You aren’t just memorizing definitions. You’re developing a gut feeling for what works.
Lower timeframes can trap you
The 1-minute chart is a casino. It prints sweeps, structure shifts, and order blocks every five minutes. But most of it is just pure noise, especially if it contradicts the 1-hour or 4-hour trend.
If you're going to dive into the micro timeframes, you have to be sharply selective. Precision is great, but getting chopped to pieces in market noise is expensive.
Part 7: A Few Filters That Improve Trade Quality
Want better trades? Start acting like a snob with your setups.
Time of day matters
A liquidity grab means a lot more during the London or New York sessions when major volume is pumping through the market. A picture-perfect setup that forms during the dead hours of the late Asian session usually doesn't have the gas to follow through.
Location matters
An order block floating in the middle of a random price range is garbage compared to one that forms at a major daily extreme. Where the setup happens is often more important than the setup itself.
The quality of the move away matters
If price barely crawls away from your zone with weak, overlapping candles, delete the drawing. You want to see price explode away. That urgency proves the big players stepped in.
Simplicity matters
Don't be that guy whose chart looks like a laser light show. If you have 15 boxes, overlapping Fibonacci levels, and a dozen text labels, you're just going to freeze when it's time to execute. Mark the obvious liquidity, the major structure, and one or two highly relevant zones. Delete everything else.
Part 8: Risk Management Is Still the Real Edge
This is the boring part, which is exactly why most people skip it—and blow their accounts.
You can be a liquidity-reading savant and still lose all your money if you risk too much per trade or revenge-trade after a loss. The market doesn't care how smart your analysis is. It only rewards consistent execution.
A perfect setup can lose. A mediocre setup can win. Accept that losses are just the cost of doing business. Keep your risk strictly tied to a small percentage of your account, leave your stops where the structure invalidates, and stop trying to get rich by Friday.
In practical terms, that means risking a small, fixed percentage per trade, keeping your stops structural rather than emotional, and walking away from the screen when you're tilted.
Describe the pattern without inventing the participant
Consider a price move above a recent high followed by a quick reversal. The move and reversal can be recorded objectively. Calling the event a liquidity grab adds an interpretation about available orders and the reason for the move. That interpretation may be plausible, but a retail candle does not establish who traded, the size of their position, or their intention.
An order-block definition should be equally explicit. Specify which candle or group of candles qualifies, how the zone is drawn, when it becomes valid, and what invalidates it. A zone selected only after a strong reaction risks becoming a description of the outcome rather than information that could have guided a trade.
Spot forex is fragmented across dealers and venues, so a single platform does not display a complete global order book. Even genuine depth data from one venue describe that venue, not every available order in the market. Avoid treating a broker's chart as a comprehensive map of institutional exposure.
The practical test is whether a rule using the pattern performs better than a reasonable alternative after costs. Include failed retests and occasions when the zone was never revisited. A useful framework can organize attention without revealing hidden intentions. Keeping those claims separate makes the analysis more credible and easier to improve when the evidence does not support it.
Record the zones that never react
An order-block chart is easy to make persuasive by preserving successful zones and deleting the rest. Save the marked area before price returns, including its boundaries and the conditions under which it expires. Then record no reaction, a failed reaction, and a successful trade under the same rules.
The record should include the cost of waiting and the trades that were missed. A method can look precise when reviewed only through completed winners. Its practical value depends on the entire sequence of decisions, including uncertainty about which zone mattered while the next candle was still unknown. 1, 2, 3
Conclusion: Learn the Story, Not Just the Label
The true power of order blocks and liquidity grabs isn't that you get to use cool insider jargon. It’s that they force you to read the market as a fluid story rather than a bunch of random, jerky candlesticks.
Once you put these glasses on, the market makes a lot more sense. Obvious support levels stop looking like safe havens and start looking like trap doors. Fast, violent moves finally have context. Pullbacks stop scaring you and start looking like real opportunities.
But stay grounded. SMC is just a lens to view the market through, not a crystal ball. It will give you better entries and keep you out of dumb retail traps, but it doesn't cure a lack of discipline.
If you really want to master this, do three things: Study complete market sequences instead of just staring at single candles. Write down iron-clad rules for what you consider a valid sweep and a valid shift. And manage your risk like every trade is going to hit your stop loss—because eventually, one will.
Trading becomes a whole lot more fun when you stop trying to guess the next tick and start waiting for a story you recognize to unfold. Wait for the bait to be taken. Wait for the big players to show their hand. And wait for price to come back to your zone.
That kind of patience is the only thing separating the guys who are constantly reacting out of fear from the traders who sit back and read the market like a book. Build your rules, stick to your script, and let the market do the heavy lifting for you. If a setup only looks good in hindsight after you've moved your boxes around, it's not ready for live money. Precision and patience will always pay better than panic.
Sources and further reading
- BIS: April 2025 FX turnover, September 2025 preliminary release
- CFTC: Eight things to know before trading forex
- SEC Investor Bulletin: Trading Basics and Order Types
Editorial revision: 7 October 2026. Numerical scenarios are hypothetical unless identified as historical. References support the added explanations and selected corrections; rules and product terms should be checked again before acting.