
An economic calendar lists scheduled releases and policy events that may affect currencies. Its value lies in preparation: knowing when information arrives, what the market expected, and which parts of the release matter. A label such as "high impact" is not a forecast of direction or size. Even a figure that beats expectations can produce a currency move that seems surprising at first glance.
Why the Economic Calendar Matters More Than Most Beginners Realize
Most of us are introduced to forex through charts, trendlines, and a handful of indicators. It makes sense because it's highly visual. It feels great to spot a pattern and trade it. But currencies aren’t like stocks; you aren't trading a single company. You’re trading the balance of power between two entire countries. When you click buy on EURUSD, you aren’t just trading a double bottom. You’re trading the relationship between the European Central Bank and the US Federal Reserve, weighing their inflation rates, interest rate paths, and overall economic health.
The calendar is essentially the schedule for when all that underlying economic reality gets updated. Stuff like inflation reads, job reports, GDP, retail sales, and central bank speeches are what institutions care about. Not all of it matters, of course. Some events cause a tiny blip on the 1-minute chart and vanish. Others dictate market direction for the next three months.
A big part of mastering the calendar is figuring out which is which. You have to learn the difference between a data point that gets quickly ignored and one that forces Wall Street to rethink their positions.
On a day-to-day basis, using a calendar gives you three huge advantages:
- Timing: You know exactly when things are about to get wild.
- Context: You get a feel for what the big players care about today.
- Risk awareness: It stops you from blindly stepping in front of a freight train five minutes before a major data release.
That last point is huge. So many blown accounts aren't the result of bad technical analysis, but terrible timing. You might have the direction 100% right, but entering three minutes before a large inflation report is a pure coin flip compared to entering three hours later once the dust has settled.
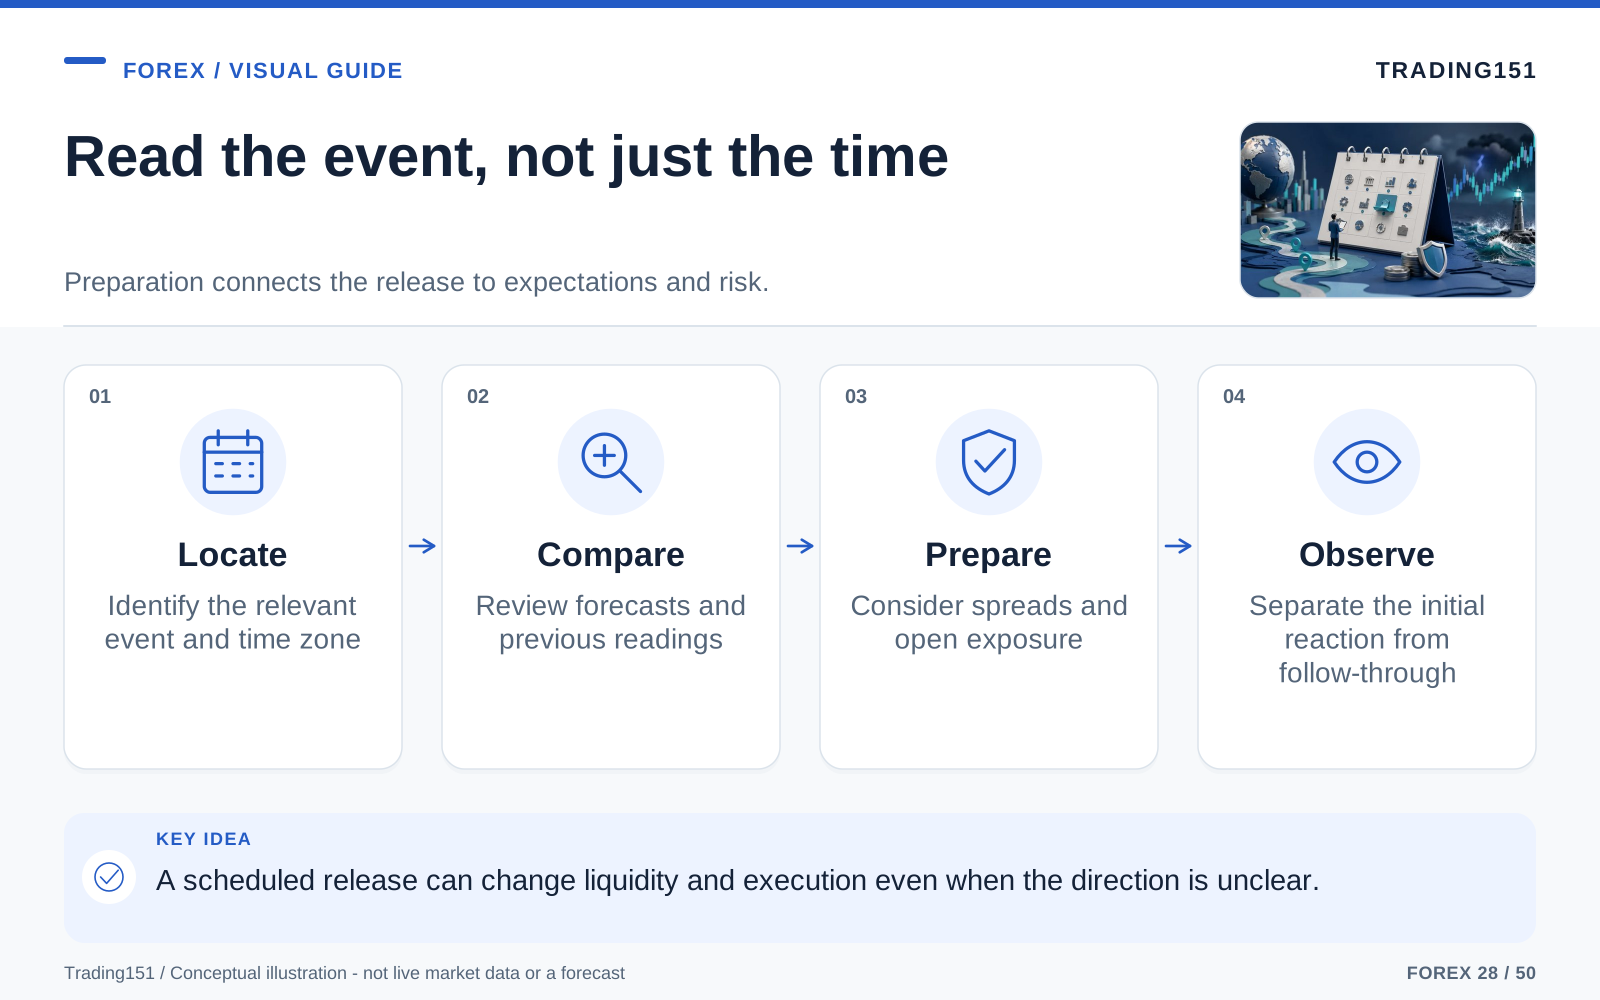
Read this diagram as text
- Locate
- Identify the relevant event and time zone
- Compare
- Review forecasts and previous readings
- Prepare
- Consider spreads and open exposure
- Observe
- Separate the initial reaction from follow-through
Think of It as a Market Attention Map
Stop looking at the calendar as a boring list of meetings and data drops. Think of it as a heat map of market attention. Markets only move when expectations change, and expectations change when major new information hits the wire.
If a large US inflation report is scheduled for 8:30 AM, you better believe every hedge fund, bank, and retail trader on the planet knows about it. Ahead of the release, big players pull their orders to reduce risk. Liquidity dries up, which means spreads widen. The simple fact that the event is going to happen changes how the market behaves hours before the actual number even comes out.
Because of this, the calendar matters even if you have zero intention of being a "news trader." The anticipation alone warps market conditions. More often than not, the smartest way to use the calendar is simply knowing when to sit on your hands.
What the Calendar Is Showing You
Pretty much all calendars look the same once you get past the visual design. Before you do anything, though, make absolutely sure the time zone is set to your local time. Trust me, messing up daylight saving time or mixing up EST and GMT is a really stupid way to lose a trade. Here’s a quick breakdown of what you're looking at:
- Time: Exactly when the data drops.
- Currency: Which currency will feel the heat (like USD, EUR, GBP).
- Event: What is happening—like an NFP report or a central bank rate decision.
- Impact: Usually color-coded (red, orange, yellow) to show how much the market is expected to care.
- Previous: What the number was last month (or last quarter).
- Forecast: What the experts are guessing the number will be today.
- Actual: The official number once it goes live.
Those last three columns—Previous, Forecast, and Actual—are where the magic happens. The market rarely cares if a number is objectively "good" or "bad." What it cares about is the gap between what everyone expected and what happened. A seemingly fantastic job report can tank a currency if Wall Street was expecting something even better. Likewise, a terrible number might cause a rally if the market was bracing for a complete disaster.
Understanding Impact Levels Without Treating Them as Gospel
Most calendars categorize events by impact level—usually low, medium, and high. It’s a great starting point, but don't treat it like the ultimate truth.
Low-Impact Events
Think of these as background noise. Hardcore economists might care, but they almost never move the charts. 99% of the time, you can completely ignore them and focus on your setups.
Medium-Impact Events
Keep an eye on these. They usually don't dictate the overall trend, but if the actual number comes in way off the forecast, they can definitely spark a sudden, annoying spike that triggers a tight stop loss. Under the right conditions, they punch way above their weight class.
High-Impact Events
This is the red-alert stuff. Rate decisions, inflation prints, and major jobs reports live here. During these events, spreads can blow out, execution gets laggy, and technical analysis basically goes out the window for a few minutes.
That being said, context is everything. A high-impact event doesn't guarantee volatility, and sometimes a medium-impact event catches the market off guard and causes absolute chaos. If everyone is terrified of a recession, suddenly those boring medium-impact GDP numbers become large market movers. If the Fed says they are strictly following the data, all data becomes much more sensitive.
The Events Forex Traders Pay Closest Attention To
Please don’t try to memorize every economic indicator. It's totally exhausting and unnecessary. You just need to know the heavy hitters that consistently move the needle.
Central Bank Rate Decisions
Money goes where interest rates are highest, so central bank decisions are the undisputed kings of the forex calendar. But here's the catch: traders aren't just looking at the rate hike or cut itself. They are obsessing over the statement, the voting split, and the overall "tone" of the press conference.
Sometimes the rate decision is exactly what everyone expected, but the currency still goes wild because the central banker sounded slightly more aggressive than usual during the Q&A. The actual words spoken usually matter just as much as the numbers.
Inflation Data
Consumer Price Index (CPI) and Producer Price Index (PPI) are large because they dictate what central banks will do next. If inflation is running hot, the market assumes interest rates will stay high (which usually boosts the currency). If inflation drops fast, people start betting on rate cuts.
But remember, the reaction is always about what the number implies for future interest rates, not just the number itself. A higher inflation number isn't universally "good" for a currency unless traders believe it will force the central bank's hand.
Employment Data
Job reports show how healthy an economy is. In the US, Non-Farm Payrolls (NFP) is the undisputed heavyweight champion. It has a reputation for moving the dollar, gold, and stock futures in seconds.
But again, it’s not just the headline jobs number. Traders are digging into the unemployment rate, average hourly wages, and sneaky revisions to last month's numbers to see the full picture.
GDP, Retail Sales, and PMI Data
These are your broader health metrics. GDP tracks overall growth, retail sales show if average people are spending money, and PMIs tell us if businesses are expanding or shrinking. They might not have the explosive second-by-second drama of a central bank decision, but they absolutely reset market expectations and drive longer-term trends when they miss the forecast.
The Market Reacts to Surprise, Not Just Data
If you take one thing away from this whole article, let it be this: markets don't react to data. They react to surprises. And "surprise" has a lot of moving parts. It’s the difference between the actual number and the forecast. But it's also about whether last month's number got quietly revised down, or if the underlying details of the report completely contradict the main headline.
Let’s say analysts expect US inflation to hit 3.4%. If the report comes out and it’s exactly 3.4%, the chart probably won't move much. Why? Because big money already positioned themselves for 3.4% days ago. It’s old news. It doesn't force anyone to change their minds.
But if the number suddenly prints at 3.8% or 3.0%, panic sets in. Everyone has to immediately re-price their models, adjust their bond yields, and scramble for new positions. That desperate rush to reposition is what causes those giant vertical candles on your chart.
This is why seemingly "good" numbers don’t automatically mean the currency will go up, and bad numbers don't always crush it. The calendar isn't about numbers in a vacuum. It’s all about expectation versus reality.
Why Price Sometimes Moves the “Wrong” Way
We’ve all seen it happen. The US drops a strong jobs report, and the dollar immediately tanks. It feels irrational, right? Usually, it’s not. It all comes back to how people were positioned before the release.
If everyone heavily bought the dollar all week expecting a great report, they have to sell those positions to take their profit once the news drops. That large wave of profit-taking pushes the price down, even though the data was fantastic. Sometimes, a tiny sub-section of the report told a much darker story than the headline. Or maybe the market didn't even care about the data because they were already looking ahead to a speech happening later that afternoon.
This is the whole idea behind "buy the rumor, sell the news." Markets often move in anticipation. By the time the actual event happens, the smart money is already cashing out.
This is why you can't use the calendar as a simple "green number = buy" signal generator. It just highlights when the market is going to digest new information. How the big players interpret that information is what dictates the price.
How Traders Usually Approach Major News Events
So, how do you trade this stuff? There’s no perfect formula, but most traders fall into one of three camps depending on their risk tolerance.
1. Stepping Aside
It’s boring, but it’s honestly the most sensible approach for a lot of traders. Simply sitting out and doing nothing during a major release is a highly professional trading strategy. Being flat is a position. There is absolutely no shame in protecting your capital when the market turns into a casino.
So many traders instantly improve their win rate just by refusing to enter a trade right before a large event. They let the initial chaos happen, wait for spreads to shrink back to normal, and look for clean setups afterward.
2. Trading the Initial Breakout
Some thrill-seekers try to catch the initial large candle by placing buy and sell stop orders right before the news hits. I'll be honest: this often ends in tears. Spreads widen so much that you get triggered at terrible prices, and the market routinely whipsaws both ways before choosing a direction.
It looks super easy when you review it on a clean chart later, but in real time, it's a messy, stressful nightmare that requires lightning-fast execution and nerves of steel.
3. Trading the Reaction After the Dust Settles
For most of us, this is the sweet spot. Instead of trying to race the Wall Street supercomputers in the first five seconds, you let the initial overreaction play out. You wait to see if the market holds the breakout or if it was just a fake-out.
Once the dust settles, normal technical analysis starts working again, but now you have a clear fundamental catalyst pushing the market. Does price pull back to a key level and hold? Does it fail immediately? Getting your entry from those clues is way more sustainable than gambling on the first spike.
The Hidden Costs of Trading News
Beginners only ever think about which way the chart is going to go. They completely ignore execution risk, which is what usually drains their accounts. During major news, how your broker handles your orders is just as important as your directional bias.
Widening Spreads
That tight, zero-pip spread you love? It disappears the second NFP drops. When big banks pull their liquidity to protect themselves, the gap between the bid and ask prices blows wide open. You could instantly be down 15 pips the moment your trade triggers.
Slippage
News candles move so fast that price can gap right past your intended entry or stop loss. Your broker won't close you out where you clicked; they'll close you out at the next available price. In a quiet market, it's barely noticeable. During a violent news drop, a small planned loss can become a large one.
False Breaks and Whipsaws
It is common for the price to shoot up 40 pips, trap a bunch of breakout buyers, and immediately crash 80 pips in the opposite direction. News trading always looks easier on Twitter than it feels live. The resulting 1-hour candle might look like a clean trend, but inside that first minute, it was a total sharp sell-off.
This is why your risk management needs to be tight around news. Smaller lot sizes, giving the market room to breathe, and simply staying out are usually much smarter plays than forcing a trade.
How to Build the Calendar into Your Daily Routine
You shouldn't be checking the calendar only after your stop loss magically gets hit. Make it a daily habit. Review it while the market is quiet, long before the session opens. Decide right then and there how you're going to handle your open positions when the news drops.
A solid morning routine looks something like this:
- Check before you chart: Before you even draw a single trendline, look at what’s scheduled for the day.
- Flag the big stuff: Note the times for any red-folder high-impact events or central bank speeches.
- Match news to pairs: If you're trading GBPJPY, you need to be aware of news out of both the UK and Japan. Don't get blindsided by the other half of your pair.
- Adjust your expectations: A day packed with heavy data drops is going to behave very differently than a quiet, technically-driven Monday.
- Don't get caught out: Never open a short-term scalp five minutes before a major event unless that is explicitly part of your strategy.
It also really helps to zoom out and ask yourself: What is the market obsessing over right now? Is everyone panicked about inflation? Are we watching for a recession? When you know the current market narrative, it becomes obvious which calendar events are going to cause the most fireworks.
Common Mistakes Traders Make with Economic Calendars
Checking a calendar takes two seconds. Using it properly takes a bit of finesse. Here are the traps almost everyone falls into:
Treating Every Red Event the Same
Just because an event has a red "high impact" tag next to it doesn't mean it's going to move the market today. Context matters. A high-impact event that doesn't fit the current market narrative will often just fizzle out.
Ignoring the Forecast
Rookies see a "good" data point and instantly click buy. They completely ignore what the market was forecasting. Remember, the surprise is what moves price, not the data itself.
Forgetting About Revisions
Sometimes the headline number looks amazing, but the fine print shows they drastically revised last month's number downward. The algorithms spot this instantly and sell off the currency, leaving retail traders super confused.
Forcing Trades Because the Event Feels Important
Just because the Fed Chair is speaking doesn't mean you are legally obligated to place a trade. Sometimes the smartest calendar play is turning off your platform for the afternoon.
Watching the Event but Ignoring Position Size
Knowing that large volatility is coming and keeping your lot size exactly the same isn’t a strategy—it's just informed gambling. If the spread and volatility are going to triple, your position size needs to adjust.
The Calendar Is a Filter, Not a Crystal Ball
That’s the healthiest mindset to have. The economic calendar is never going to tell you exactly where a currency is headed. But it will tell you when market conditions are about to change rapidly, when your technical analysis is likely to fail, and when the big players are stepping in.
That alone is priceless. Trading is sharply hard already; you don't need to make it harder by getting blindsided by a random central bank announcement. The calendar keeps you grounded. It forces you to respect timing, which is honestly one of the biggest, most underrated edges you can have as a retail trader.
As you get used to checking it, something cool happens. You’ll stop seeing candlesticks as random, chaotic movements and start seeing them as real-time reactions to human sentiment, economic shifts, and policy changes. It doesn’t necessarily make trading easy, but it definitely makes it make sense.
Read the release, not just the calendar's colored label
A release usually contains more than a headline. An employment report, for example, may include changes to earlier months, wage data, and measures drawn from different surveys. Traders can respond to those details rather than to the single number displayed first by a calendar provider. Read the official release when the distinction matters to the trade.
The consensus estimate is not a universal market belief. It depends on the forecasters surveyed, the collection time, and the provider's method. Expectations may also shift before publication. Record which estimate you used, rather than assuming that every service presented the same benchmark.
Check the clock carefully. Economic releases are scheduled in a local time zone, and the relationship to your own clock can change around daylight-saving transitions. Confirm the date and time with the issuing institution for important events. A platform's server time is another separate setting that may not follow the clock on your phone.
Prepare both an action and a no-action response. You might choose to close exposure beforehand, leave an existing position under its original risk plan, or avoid new trades until execution conditions settle. None is universally best. What matters is deciding before the release, when a widening spread or a fast first move can otherwise turn an information event into an improvised bet.
Check the release convention
Economic calendars can display the provider's estimate, a consensus forecast, the previous figure, and a revised previous figure. Those are different values. Before interpreting a surprise, identify which comparison is being made and whether the earlier number changed. The release time and time zone should also be confirmed with the issuing authority for an event that matters to an open position. 1, 2, 3
A Few Closing Thoughts
If you’re committed to trading forex, checking the economic calendar needs to become as natural as checking your charts, managing your watchlist, or calculating your risk. Not because it’s some magical cheat code for perfect entries, but because it saves you from getting run over by fundamental forces you can't see on a chart.
When you use it right, it keeps you out of terrible trades, warns you when the market is about to go crazy, and helps you figure out why a currency is suddenly ripping to the upside. It teaches you to respect the difference between a normal market and an dangerous one. And it constantly reminds you that behind every pip movement, there's an actual economy being judged in real time.
Ultimately, it allows you to trade with total awareness rather than constantly getting caught off guard. In this game, avoiding those unnecessary surprises is half the battle won. The calendar is your ultimate planning tool—it lets you deliberately choose when to trade the news, when to wait for the dust to settle, and when to simply walk away and live to trade another day.
Sources and further reading
- Bank of England: Money Creation in the Modern Economy
- CFTC: Eight things to know before trading forex
- BIS: April 2025 FX turnover, September 2025 preliminary release
Editorial revision: 7 October 2026. Numerical scenarios are hypothetical unless identified as historical. References support the added explanations and selected corrections; rules and product terms should be checked again before acting.