
On-chain analysis studies information recorded on a blockchain, such as transactions, balances, and the history of unspent outputs. It can reveal useful patterns, but the data do not come with a complete explanation of who acted or why. Wallet software, custodians, internal transfers, and classification methods can all shape the numbers. The analysis is strongest when observed activity is kept separate from inferred behavior.
What On-Chain Analysis Means
At its core, on-chain analysis is just studying the data stamped directly onto a blockchain. For Bitcoin, that means pulling up the public ledger where every confirmed transaction has been recorded since the network went live.
Every time Bitcoin jumps from one address to another, that move gets permanently baked into the blockchain. You can see exactly how much moved, where it came from, where it went, the transaction fee, and exactly when it happened. And the best part? You don't need to ask a bank, a broker, or a government agency for permission to look at it. Anyone with an internet connection can spin up a Bitcoin node, browse a block explorer, or fire up an analytics platform to turn all that raw data into readable charts.
Now, this doesn't mean everyone's real-world identity is out in the open. Bitcoin is pseudonymous—think of it like a pen name—rather than strictly anonymous. Instead of John Doe, transactions are linked to addresses, which are just long, messy strings of letters and numbers. You might never figure out who owns a specific address, but you can still watch exactly when their coins arrive, when they leave, and how long they sit there gathering dust.
That's the magic of Bitcoin. The network keeps names off the receipts, but the financial footprints are there for everyone to see. It gives us an rich field to study. We might not be able to read anyone's mind, but we can definitely track their habits.
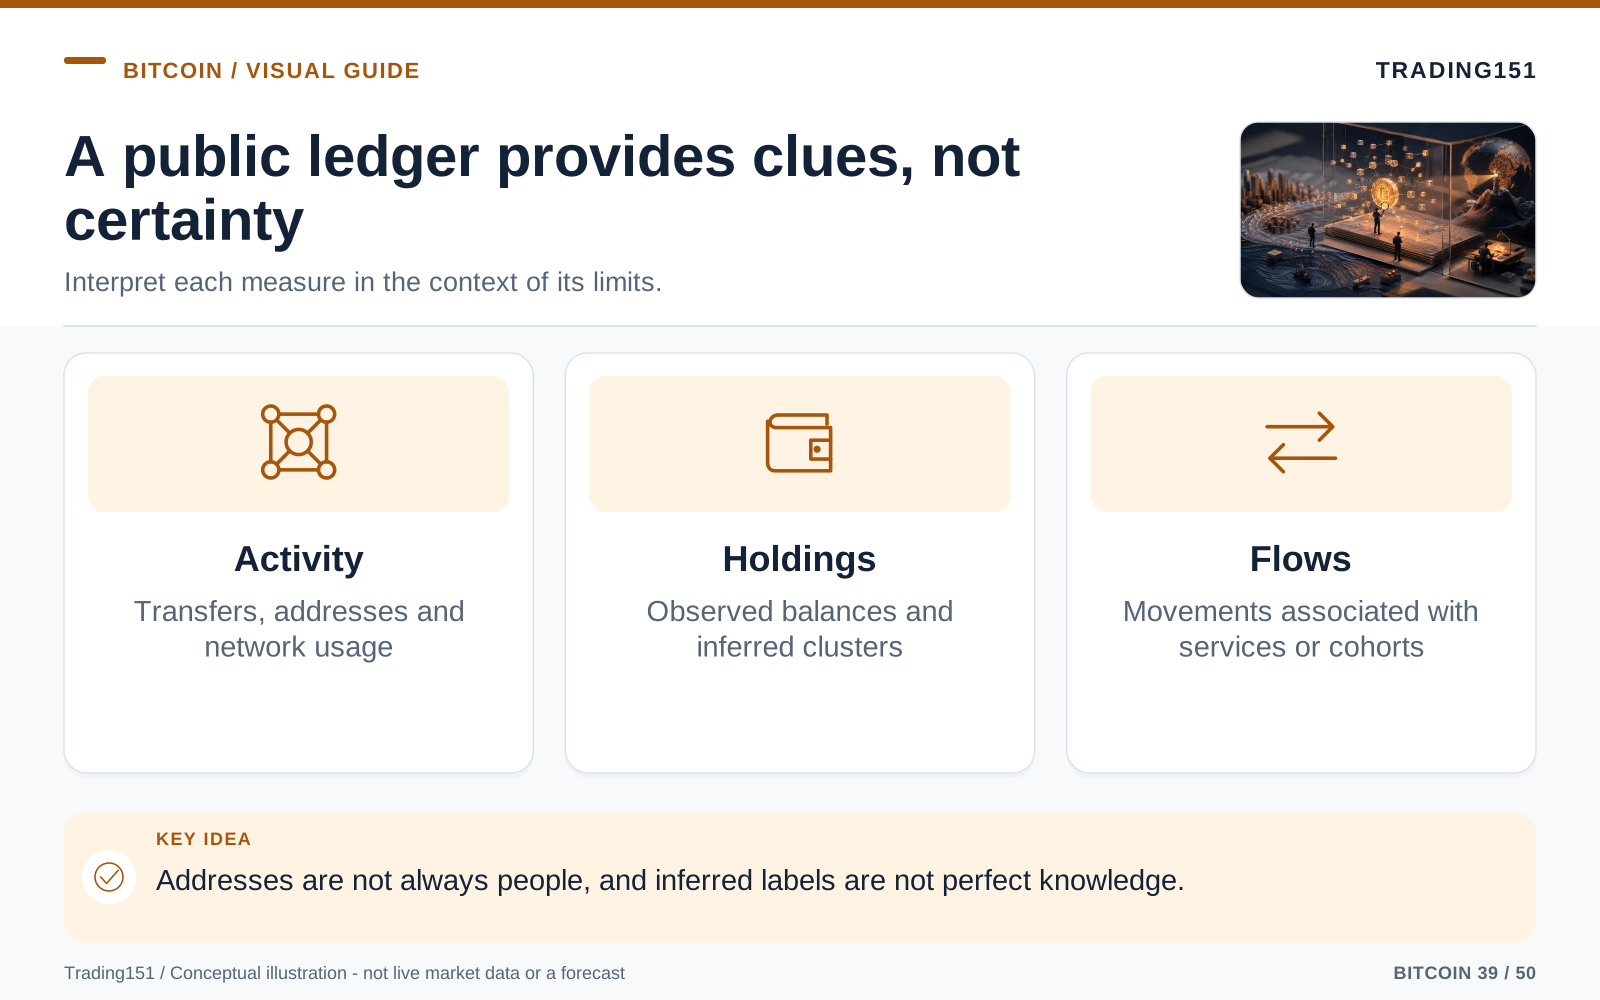
Read this diagram as text
- Activity
- Transfers, addresses and network usage
- Holdings
- Observed balances and inferred clusters
- Flows
- Movements associated with services or cohorts
Why Bitcoin’s Public Ledger Matters
In pretty much every other market, investors are basically flying blind. Stock traders read earnings reports, listen to management interviews, and study price charts. Bond investors watch interest rates. Commodity traders track shipping routes and warehouse inventories. All of that is helpful, but it's usually delayed, heavily filtered, or missing large chunks of context.
Bitcoin brings something entirely new to the table. Because the asset lives on a transparent network, you can watch the money move in real time. You can spot when coins that have been dead quiet for half a decade suddenly wake up. You can estimate if the people selling right now are taking a profit or taking a bath. You can watch funds flood into or drain out of exchanges. You can even break down how different sizes of investors—from everyday retail folks to institutional heavyweights—are behaving at different points in the market cycle.
That’s exactly why people often call on-chain analysis the "third branch" of market research. You’ve got technical analysis (staring at price, volume, and chart patterns), and you’ve got fundamental analysis (figuring out if a business or asset has value). On-chain analysis is the missing puzzle piece: looking directly at the behavior of the people and groups using the network.
For Bitcoin, this is absolutely large. There’s no CEO to fire, no earnings call to listen to, and no PR team spinning the narrative. The closest thing Bitcoin has to a beating heart is the blockchain itself.
Addresses, Wallets, and Entities
Before we go any further, we need to clear up the difference between an address and an entity. The blockchain is 100% precise about transactions, but it's intentionally silent about the humans behind them. Trying to group a bunch of addresses together and assign them to a single "entity" takes some detective work. Sometimes, if a group of inputs is spent together, it's a safe bet they belong to the same wallet. But collaborative transactions and privacy tools can easily throw a wrench in that logic. We can spot known exchange addresses and use them to label nearby activity, but these companies are always updating their infrastructure. A good analyst won't present these groupings as hard facts, but rather as educated guesses with varying levels of confidence. Every time you try to connect an address to a human story, you're dealing with probabilities.
Think of a Bitcoin address as a destination—kind of like a bank account number, but not quite. You can spin up as many addresses as you want, and modern wallets automatically generate a brand-new one every time you receive a payment. It's totally normal for a single person to control dozens or even hundreds of addresses without anyone else realizing it.
An "entity," on the other hand, is an analyst's best guess at grouping addresses that seem to be controlled by the same person, company, exchange, or miner. They look for behavioral footprints to make these connections. For instance, exchanges handle such a large, chaotic volume of deposits and withdrawals that their wallets usually stand out like a sore thumb.
This kind of grouping is useful, but it’s definitely not flawless. On-chain analysis is a game of probabilities, not certainties. A chart might strongly suggest that a large holder is moving coins onto an exchange, but you still have to figure out why they're doing it.
Analysts love to group these entities by size, usually sticking to the ocean-themed nicknames that have become a staple of Bitcoin culture:
- Shrimps: The little guys. These are smaller holders, usually defined as wallets holding less than 1 BTC.
- Crabs and fish: The middleweights. Think dedicated retail investors or smaller professional traders.
- Dolphins, sharks, and whales: The heavy hitters. These are the large accounts that hold enough Bitcoin to shift market psychology when they wake up and move their coins.
- Exchanges and custodians: The giant pools. These addresses usually hold funds for thousands or millions of different customers rather than a single billionaire.
The names might be goofy, but the behavior matters. If the shrimps are panic-selling while the whales are quietly scooping up cheap coins, that paints a substantially different picture than a market where the whales are dumping their bags onto over-excited retail buyers.
UTXOs: The Cash-Like Pieces of Bitcoin
"UTXO" stands for Unspent Transaction Output. It sounds horribly technical, but the easiest way to wrap your head around it is to think about physical cash.
If you walk into a coffee shop with a $50 bill and buy a $12 latte, you don't rip a $12 piece off your bill and hand it to the barista. You hand over the $50, and you get $38 back in change. Your wallet now holds a completely different set of bills than it did when you walked in.
Bitcoin does exactly the same thing. If you have a chunk of 1 BTC sitting in your wallet and you send your buddy 0.2 BTC, the network doesn't just shave off a sliver. Instead, it "spends" that entire 1 BTC chunk, sends the 0.2 BTC to your friend, and routes the remaining 0.8 BTC back to you as change—usually dropping it into a brand-new address in your wallet.
Those leftover, unspent chunks sitting in wallets? Those are your UTXOs. They're just pieces of Bitcoin waiting to be spent.
UTXOs are a big deal because every one has a backstory. Analysts can check exactly when a specific coin last moved. Was it yesterday? Last summer? Back in 2015? That age gives us large clues about market sentiment. It helps us gauge fear, speculation, conviction, and whether people are thinking long-term.
Coins that bounce around constantly usually belong to traders, exchanges, or newbies. But coins that sit perfectly still for years? That’s a totally different mindset. Those usually belong to die-hard long-term holders, lost wallets, deep cold storage, or investors who couldn't care less about short-term price drama.
Why Coin Age Tells a Story
One of the most fascinating, purely human aspects of on-chain analysis is looking at the age of coins. A Bitcoin that hasn't budged in eight years carries a completely different emotional weight than one that was just traded this morning.
When deeply asleep coins suddenly wake up, analysts sit up and pay attention. Sometimes it just means an early adopter is finally taking some chips off the table. Other times, someone is just shuffling funds for security. But it can also signal that a large seller is gearing up to make a move. The blockchain gives us the facts, but figuring out the "why" requires a lot of context.
On the flip side, when old coins refuse to budge during a severe market crash, that speaks volumes too. It tells us the veterans aren't hitting the panic button. They’ve likely survived multiple boom-and-bust cycles and still buy into the long-term vision. Or maybe they bought in so early that their cost basis is practically zero, making today's volatility feel like a minor speed bump.
This is exactly how Bitcoin's ledger transforms from a boring database into a real-time behavioral archive. It lets you watch patience gradually turn into profit-taking, fear devolve into full-blown capitulation, and boredom slowly morph into quiet accumulation.
Realized Capitalization: A More Grounded View of Value
You’re probably familiar with traditional market capitalization. For Bitcoin, you find the market cap by multiplying the current price by every coin currently in circulation. It’s a great headline number, but it’s fundamentally flawed: it pretends that every Bitcoin was bought at today’s exact price.
But that’s simply not how markets work. Some coins were snapped up for a few hundred bucks. Some were mined back when Bitcoin was essentially worthless. Some were bought at the absolute peak of a euphoric bull run, and others have been lost for so long they’re probably gone forever.
Realized capitalization fixes this by looking at things more realistically. It values every individual coin at the exact price it was trading at the last time it moved on the blockchain. Instead of asking, “What’s all this worth right now?”, realized cap asks, “What did the market pay for these coins the last time they changed hands?”
Now, it’s not a perfect system. Sometimes people just move coins between their own wallets, which updates the "last moved" price without changing ownership. Even so, realized cap is useful because it cuts through the hype and smooths out the wild exaggerations of raw market cap.
In plain English? Realized cap gives us the market's true cost basis. It shows us how much real money is "parked" in Bitcoin based on historical movement, not just whatever the price happens to be doing today.
MVRV: Measuring Heat in the Market
Once you’ve got your head around realized cap, MVRV is a breeze. It stands for Market Value to Realized Value, and it’s basically just comparing Bitcoin’s current market cap to its realized cap.
When the MVRV ratio is running high, it means the current price is way above the network's average cost basis. People are sitting on large paper profits. Now, that doesn't automatically mean a crash is imminent, but it definitely tells us the market is running hot. The fatter those unrealized profits get, the more tempting it becomes for folks to start hitting the sell button.
Conversely, when MVRV drops super low, the market price is scraping along—or even dipping below—the realized value. Most players are either just breaking even or drowning underwater. Fear takes over. Casual investors get bored and leave. The news cycle turns bleak. Historically, these miserable periods tend to mark cycle bottoms, though they can drag on and inflict a lot of pain before things turn around.
MVRV is brilliant because it puts price into context with human behavior. A high price might still have room to run if the network's cost basis has been rising right alongside it. A "cheap" price might still have a trapdoor underneath it if everyone's confidence is shattered. It doesn’t give you certainty, but it definitely gives you a sense of where the boundaries are.
SOPR: Profit, Loss, and the Psychology of Selling
SOPR stands for Spent Output Profit Ratio. The name is a mouthful, but the concept is beautifully simple. It looks at the coins moving around today and compares their current price to the price they were at the last time they moved.
Basically, SOPR answers one crucial question: Are the people spending their coins today taking a profit or taking a loss?
- SOPR above 1: The coins moving today are, on average, being sold for a profit.
- SOPR below 1: The coins moving today are, on average, being dumped at a loss.
- SOPR hovering around 1: The market is basically at a break-even point for the coins currently in motion.
This one little metric acts like a mood ring for the entire market. In a raging bull market, whenever SOPR dips back down to 1, it usually acts like an emotional reset. Traders lock in their profits, the hype cools off, and holders stubbornly refuse to sell at a loss. That break-even point often becomes a strong floor of support.
But in a bear market, that exact same level does the total opposite. Investors who have been trapped underwater for months will use any small rally back to their break-even point as an escape hatch. They sell the second they can get their money back, and that wave of selling pressure just shoves the price right back down.
That’s why people love SOPR—it’s a direct window into market psychology. It shows you when folks are happily cashing out, when they’re stubbornly holding the line, and when they’re finally throwing their hands up and capitulating.
Exchange Flows: Watching Coins Move Toward or Away From the Exit
If you want to know what people are about to do, watch where they send their money. Most active trading happens on centralized exchanges, so analysts keep a hawk-eye on exchange flows. If a mountain of Bitcoin suddenly moves into exchange wallets, the natural assumption is that someone is getting ready to sell. If large chunks are flowing out of exchanges, it usually means holders are pulling their coins into cold storage to lock them away.
The rules of thumb are pretty straightforward:
- Inflows: Coins moving onto exchanges usually mean an increase in potential selling pressure.
- Outflows: Coins leaving exchanges reduce the available supply, hinting at a long-term holding mindset.
- Balances: The total amount of Bitcoin sitting on exchanges tells us how much supply is liquid and ready to be traded.
Of course, it’s not always black and white. A whale might send coins to an exchange to use as collateral, trade derivatives, or just reorganize their setup. Exchanges also shuffle their own internal wallets around all the time, so context is everything.
Still, exchange flows are a phenomenal compass. During quiet accumulation periods, a steady stream of outflows tells you that smart money is draining supply off the market. During chaotic moments, large inflows warn you that people are rushing for the exits or gearing up to hedge against crazy volatility.
Long-Term Holders and Short-Term Holders
Analysts generally split the Bitcoin crowd into two main camps: long-term holders and short-term holders. The exact cutoff can vary, but the vibe is easy to grasp.
Short-term holders are the new blood. Their coins haven't been sitting still for very long, and their conviction hasn't really been tested yet. They're highly reactive—they panic at scary headlines, get swept up in Twitter hype, and swing with the price volatility. In bull markets, they show up late to the party, driven by FOMO. In bear markets, they’re the first ones bailing out.
Long-term holders are the stoic veterans. Their coins have been gathering dust for a while, pointing to serious conviction (or, occasionally, lost keys). These guys tend to sell into the hype when prices go parabolic and quietly accumulate when there's blood in the streets. They aren't flawless predictors of the market, but their hands are much steadier than the newcomers.
Tracking the tug-of-war between these two groups is revealing. When the veterans are quietly stacking while the tourists are getting bored and leaving, the market is usually building a solid foundation. When the old-timers finally start dumping their bags into a tidal wave of retail FOMO, things are probably getting dangerously overheated. And when the short-term guys are deeply underwater and panic-selling everything? You’re probably watching capitulation play out in real time.
HODL Waves: The Market as a Living Organism
If you want a truly beautiful way to visualize on-chain data, look at HODL waves. They take the entire Bitcoin supply and slice it up based on how long it’s been sitting still: a day, a week, a month, a year, five years, and so on. The result is a vibrant, layered chart showing the ebb and flow of dormant versus active coins.
During those long, grueling bear markets, the older bands get thicker. People stop trading. The tourists go home. The media stops caring. The folks who just wanted to get rich quick get bored and sell. Meanwhile, the die-hards just sit on their hands, and some keep quietly stacking.
But then the winds change. The price starts climbing, new buyers flood in, and Bitcoin is back on the front page. Eventually, those deep-sleep coins start to wake up. The thick bands of old supply start shrinking, while the younger, short-term bands balloon. That’s your visual proof that the veterans are cashing out and passing the torch to the new guys.
Looking at a HODL wave chart almost feels like watching a living, breathing organism. You can see patience building up during the boring times, conviction being tested during the scary times, and euphoria driving sell-offs at the top. It won’t tell you what day the cycle will end, but it perfectly illustrates the grand transfer of wealth between different mindsets.
Coin Days Destroyed and Dormancy
It’s not just about how much Bitcoin is moving—it’s about how important that movement is. That’s where metrics like "coin days destroyed" and "dormancy" come into play.
Here’s the math: a "coin day" is created every time one Bitcoin sits untouched for a full 24 hours. If you leave 10 BTC alone for 100 days, you’ve racked up 1,000 coin days. The moment you finally move those coins, all those accumulated days are "destroyed."
Why should you care? Because old coins speak louder than young coins. If a day-trader flips the same stack of coins back and forth all week, it doesn't tell us anything about the market's deeper conviction. But if a large chunk of coins that has been completely dead for five years suddenly springs to life? Analysts take notes.
A huge spike in coin days destroyed usually means the sleeping giants are waking up. It often happens right around major profit-taking zones, during big custody shifts, or when the old guard decides the market has fundamentally changed. "Dormancy" looks at this exact same behavior from a slightly different angle, tying the age of spent coins to overall transaction volume. Used together, these tools help cut through the daily noise and highlight the moves that matter.
Miner Behavior: The Network’s Industrial Backbone
Miners are a totally unique breed in the Bitcoin ecosystem because they’re the only ones creating fresh supply. They pour large amounts of money into hardware, facilities, cooling systems, staff, and most heavily, electricity. In exchange, they earn newly minted Bitcoin and transaction fees.
Unlike a regular investor who can just walk away and ignore the charts, miners have actual bills to pay. Even the most die-hard, bullish miner on earth has overhead. That makes their behavior telling.
When miners are holding onto their coins, it usually signals confidence, or at least that their profit margins are fat enough that they don't need to sell. But when miners start dumping aggressively, it’s a red flag. It usually points to financial stress, severe operating costs, plummeting coin prices, or a desperate need for cash. During large market crashes, "miner capitulation" is often a severe but necessary part of hitting a true bottom—the weakest players are forced to liquidate everything and shut off their machines.
Analysts keep a close eye on miner reserves, what they’re sending to exchanges, hash rate growth, and revenue trends. No single metric gives you the whole answer, but together, they show you whether the folks securing the network are thriving, barely surviving, or getting crushed.
Fees, Block Space, and Real Network Demand
People tend to forget that Bitcoin isn’t just a digital asset you sit on; it’s an active settlement network. And that means demand for block space tells a story of its own. Transaction fees spike when the network gets crowded and people are willing to pay a premium to jump the line. When things go quiet, fees plummet.
Fee data is essentially a real-time pulse of network demand. A large fee spike could be triggered by wild exchange activity, a new craze like inscriptions, total market panic, or just the sheer excitement of a bull run. Low fees generally point to a relaxed, sleepy market where nobody is in a rush.
Because price charts usually steal all the glory, fee data flies under the radar. But paying attention to how much people are willing to spend to use the network can give you incredible insight into Bitcoin's fundamental health and activity levels.
How Analysts Turn Raw Data Into a Market View
Data by itself is just noise. The real art of on-chain analysis is stitching all these different metrics together to form a cohesive, logical story. Think of an analyst like a detective at a crime scene—one footprint doesn't solve the case, but combined with a fingerprint and a timeline, the picture gets pretty clear.
For example, let's say the price of Bitcoin starts mooning. On its own, that’s great news. But an on-chain analyst will dig deeper. Are long-term holders starting to cash out aggressively? Is MVRV flashing red because the market is unusually overvalued? Are exchange inflows rising rapidly as whales line up to dump? If the answers are yes, that "bullish" price action might be a giant warning sign that the top is near.
Conversely, imagine the market has been bleeding out for months. Morale is in the gutter. But under the hood, on-chain data might show that short-term holders have completely capitulated, selling at a large loss (low SOPR), while long-term holders are quietly scooping up everything hitting the market. That’s a classic setup for a cycle bottom.
Again, this isn’t fortune-telling. Bull markets can stay irrational way longer than anyone expects. But on-chain analysis paints a vivid picture of the underlying risk. It tells you when the experienced veterans are handing the bags over to the latecomers. It doesn't replace your own judgment—it just makes your judgment significantly sharper.
A Simple Framework for Reading On-Chain Data
If you’re diving into this for the first time, it’s easy to drown in all the weird acronyms and complicated charts. Keep it simple. Start by asking basic questions and let the data back you up.
- Where is the money going? Keep an eye on exchange inflows, outflows, and large whale movements.
- Who is making the moves? Figure out if the activity is coming from whales, miners, nervous newbies, or battle-tested veterans.
- Is the market in pain or profit? Tools like SOPR will tell you if folks are cashing out large gains or crying through heavy losses.
- Is the rubber band stretched too tight? MVRV and realized price give you a reality check on whether the market is dangerously overheated or totally washed out.
- Are the sleeping giants waking up? HODL waves and coin days destroyed will flag when the patient money suddenly decides it’s time to act.
- What’s the bigger picture? Never read on-chain data in a vacuum. Always factor in macro stuff like interest rates, ETF flows, regulations, and overall global panic.
Stick to this framework, and you won’t get lost. Instead of begging a single chart to predict the future, you’re reading the room and understanding the vibe of the market.
The Privacy Question
There is a slightly creepy side to all this radical transparency. Having an open ledger is an absolute goldmine for analysis, but it also means that your financial life can be dissected by basically anyone—researchers, governments, corporations, or just bored people on the internet.
A lot of beginners assume Bitcoin is totally anonymous because there aren't any names attached to the addresses. That is a massively dangerous assumption. The second an address gets linked to your real-world identity—maybe through an exchange KYC check, a careless online purchase, a leaked database, or even a public donation—your entire transactional history can be mapped out.
That’s exactly why hardcore Bitcoiners are obsessed with privacy tools, coin control, and proper self-custody. It’s also why analysts need to stay humble. You can track coins moving across a screen all day long, but knowing that a transaction happened is very different from knowing why it happened.
The Limits of On-Chain Analysis
As amazing as on-chain data is, you have to remember it isn’t a crystal ball. It’s a tool for understanding the present, not a cheat code for the future. Plus, a large chunk of the market action doesn't even happen on the blockchain. You’ve got ETFs trading, internal exchange ledgers shifting balances, derivatives swinging the price, and institutional custodians moving ownership around without ever moving a physical coin. You can look at an on-chain chart that seems totally dead, while large risk is bubbling up off-chain.
First off, the data can be noisy. A whale shifting a mountain of coins to an exchange might look like they're about to dump the market, but they could just be rebalancing their collateral, swapping custody providers, or doing routine wallet maintenance.
Second, the real action often sidesteps the blockchain entirely. The vast majority of day-trading happens inside the walled gardens of centralized exchanges. Toss in leverage, liquidations, ETF flows, and heavy institutional derivatives, and you have large price movers that leave absolutely zero footprint on the Bitcoin ledger.
Third, macroeconomics can easily bulldoze on-chain signals. It doesn't matter how pretty your on-chain accumulation charts look if the Federal Reserve suddenly hikes interest rates, a large bank collapses, or a global crisis breaks out. Real-world panic trumps blockchain metrics every time.
Finally, the game is always evolving. More and more Bitcoin is getting locked up by ETFs, corporations, and large funds. Exchanges upgrade how they store things. Layer-two networks like Lightning take action off the main chain. If an analyst just blindly relies on the same patterns from 2017, they’re going to get left behind.
Common Mistakes Beginners Make
The absolute worst thing you can do as a beginner is treat every metric like a literal "buy" or "sell" alarm. On-chain data is context. It tells you about the weather, the mood, the pressure, and the incentives. It very rarely taps you on the shoulder and says, "Do this right now."
Another classic rookie mistake is assuming every large transaction is part of some grand conspiracy. Huge wallets move money for totally boring reasons every day. Custodians reorganize their cold storage. Miners consolidate their payouts. Without the proper context, a giant transaction is just a giant transaction.
People also get way too obsessed with whales. Yes, whales matter, but they aren't some synchronized team working in a smoky back room to wreck your portfolio. Some are early nerds who forgot their passwords, some are large hedge funds, some are exchange cold wallets, and some are just algorithmic traders. Treating them all as one giant mastermind is a fast track to terrible analysis.
Lastly, pay attention to timeframes! A metric designed to spot a macro cycle top might be completely useless if you're trying to figure out what the price will do by Friday. Always ask yourself what timeframe the chart is built for.
Why This Matters for Everyday Investors
Historically, the financial world has been completely rigged in favor of the insiders. Wall Street had the faster data, the better tools, the deep connections, and the inside scoop. Regular people were left crumbs—we just got a delayed price chart and some talking heads on TV explaining what happened after the big boys had already made their money.
Bitcoin doesn’t totally erase that imbalance. The big firms still have terrifyingly fast models and armies of quants. But the fact that the actual base-layer data is public changes the game entirely. The raw material is out there for anyone who wants to look.
If you're just a regular investor who takes the time to learn these concepts, you can stop flying blind. You don't have to just react to Twitter hype and fear anymore. You can see when the panic sellers are exhausted. You can watch the smart money quietly accumulating at the bottom. You can spot the euphoria boiling over before the crash happens. You can make decisions based on reality.
Don't worry—you don’t need a PhD in data science to use this stuff. You don't have to build your own custom dashboards or stare at charts all day. Just grasping the core concepts is enough to make the wild world of Bitcoin feel a whole lot more logical.
Reading the Blockchain Without Losing the Plot
The healthiest way to approach on-chain analysis is to treat it with curiosity, not absolute certainty. The blockchain is not a fortune teller. It is an immutable, raw record of human behavior. It tracks movement, patience, panic, pain, and profit.
Your job as an observer isn't to force the data to give you an exact price prediction. It's to take all those little clues and piece together a thoughtful, level-headed view of what the market is feeling right now, without pretending to know more than the data proves.
An address is not a person, and a transfer is not always a sale
A large transfer to an address labeled as an exchange may suggest that coins could become available for sale. It does not prove that a sale occurred. The transfer could be collateral, a custody movement, or a transaction involving an address whose label is incomplete or outdated. Explain the inference and its alternatives rather than presenting a transfer alert as a confirmed market decision.
Entity counts need similar care. One person can control many addresses, while an exchange can hold coins for many customers through a small number of addresses. Address growth therefore is not a direct count of new users. Clustering methods can improve an estimate, but they introduce assumptions that should remain visible.
Some metrics also depend on economic interpretations of transaction history. A coin's last movement can be used in a model of acquisition value, for example, without being the actual price its present owner paid. A transfer between the same owner's wallets can change an on-chain measure while leaving economic ownership unchanged.
Use several kinds of evidence and keep the timing consistent. A metric published after a market move cannot explain a decision made before it was available, and revised address labels can change historical results. Treat on-chain data as a source of observations to investigate alongside prices, liquidity, and off-chain activity. It is not a transparent window into every holder's intentions.
Labels deserve their own uncertainty
On-chain analysis often depends on identifying which addresses belong to an exchange, miner, service, or large holder. Those labels can be incomplete or change as new information becomes available. A transfer interpreted as an exchange deposit may instead be an internal reorganization or a movement through a custodian.
Keep the observed transaction separate from the attributed owner and the proposed motive. The first may be directly visible; the other two involve additional evidence and inference. A sound research note says where the labels came from and how sensitive the conclusion is to a mistaken classification. A large transfer is a reason to investigate, not automatic proof of an imminent sale. 1, 2
Use the Data, Don’t Worship It
When you use it right, on-chain analysis pulls you out of the daily noise and gives you a bird's-eye view. You get to see where the money is flowing, who is standing their ground, who is getting squeezed, and how the psychology of the market shifts from greed to fear and back again.
That is the real magic of Bitcoin’s public ledger. It’s not just a receipt of transactions. It’s a permanent record of human behavior. And behavior is what drives every market on earth.
Sources and further reading
Editorial revision: 7 October 2026. Numerical scenarios are hypothetical unless identified as historical. References support the added explanations and selected corrections; rules and product terms should be checked again before acting.